Discover the Cartography space and how to use its different features
Introduction
The site mapping, or digital twin, is the digital model of the industrial site and it is managed by the Energy Manager of the site. The diagram representing the industrial site is built using elements defined and specified in METRON‘s ontology knowledge database.
Site mapping allows the representation of the following elements of an industrial site:
- Scopes: used to define a geographical area, a building, a room, or a group of assets that are located close to each other at the industrial site.
- Industrial Assets: used to create a particular type of asset such as compressors, cooling towers, tanks, etc.
- Energy Uses: used to conceptually regroup assets that have the same function in terms of industrial production. For example: cold production, steam generation, electricity, etc.
Navigation
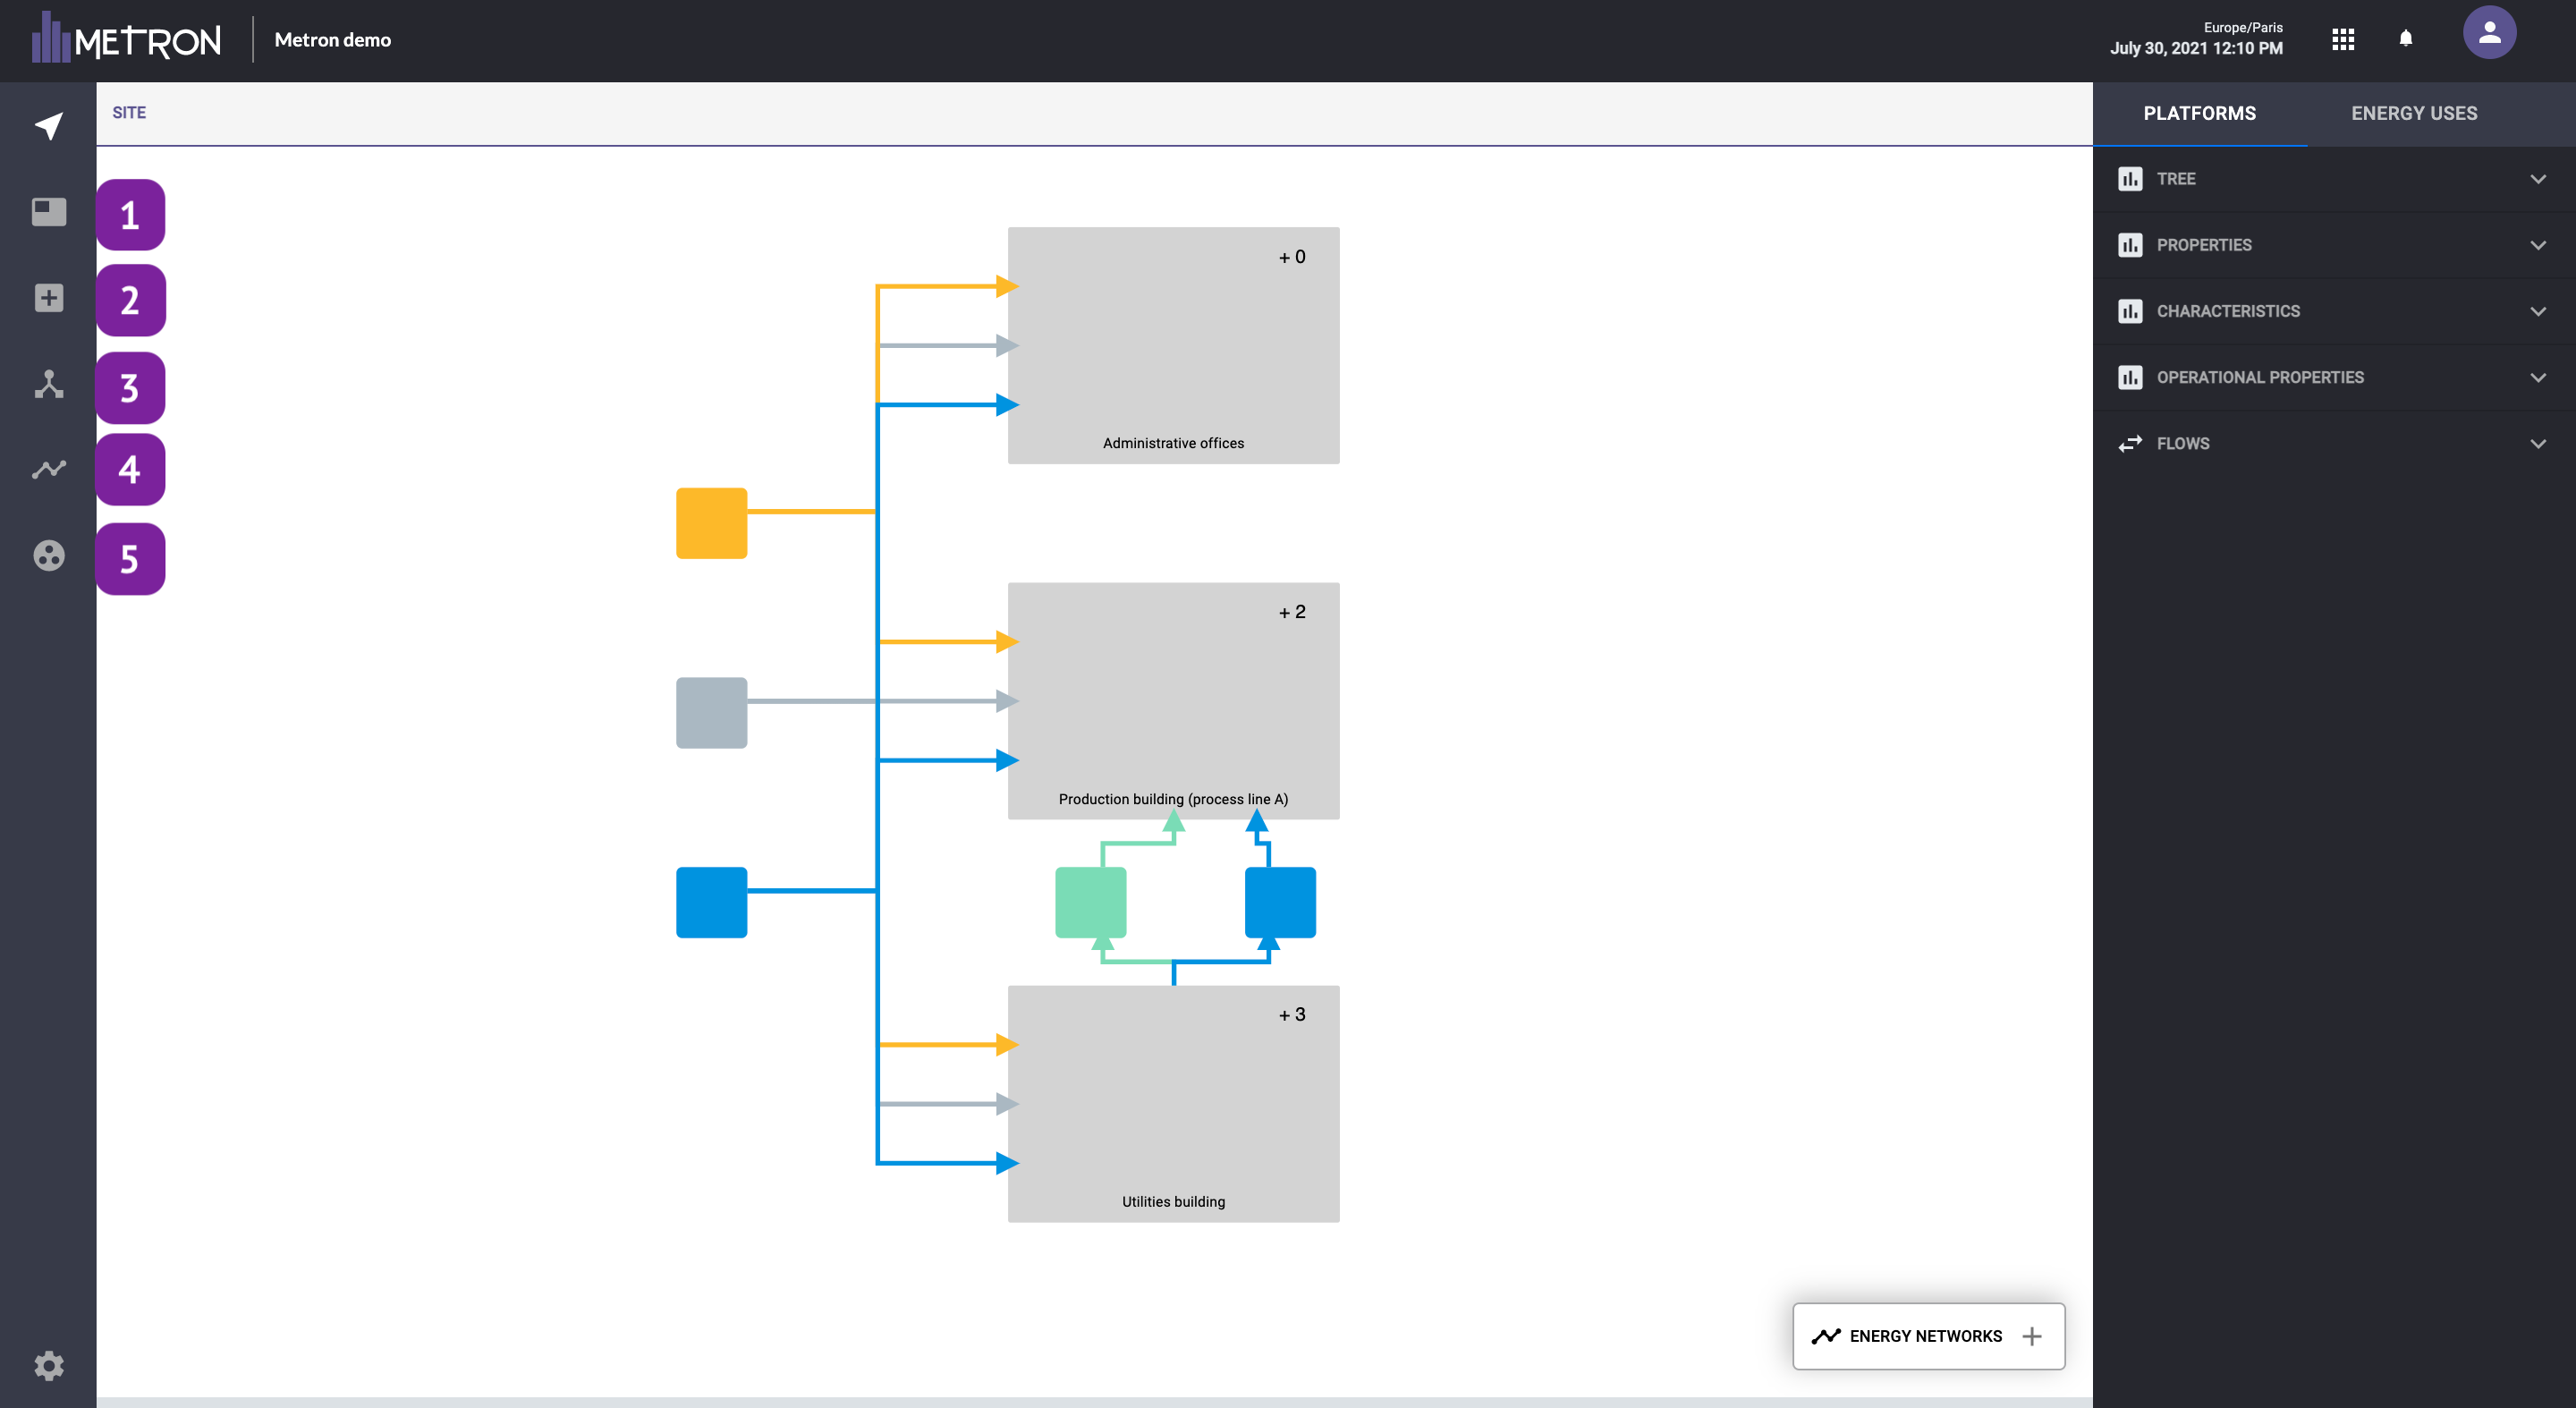
1. Create scope tool
The scope is defined as a group of assets and can be identified as a grey box with a “+number” on the top right. To create a scope, the only information required is the name.
Once created, we can enter into the asset by clicking on it and pressing the button:

2. Create asset tool
Allows you to create any new asset (compressor, dryer, exchanger, pump, condenser…) and define their properties
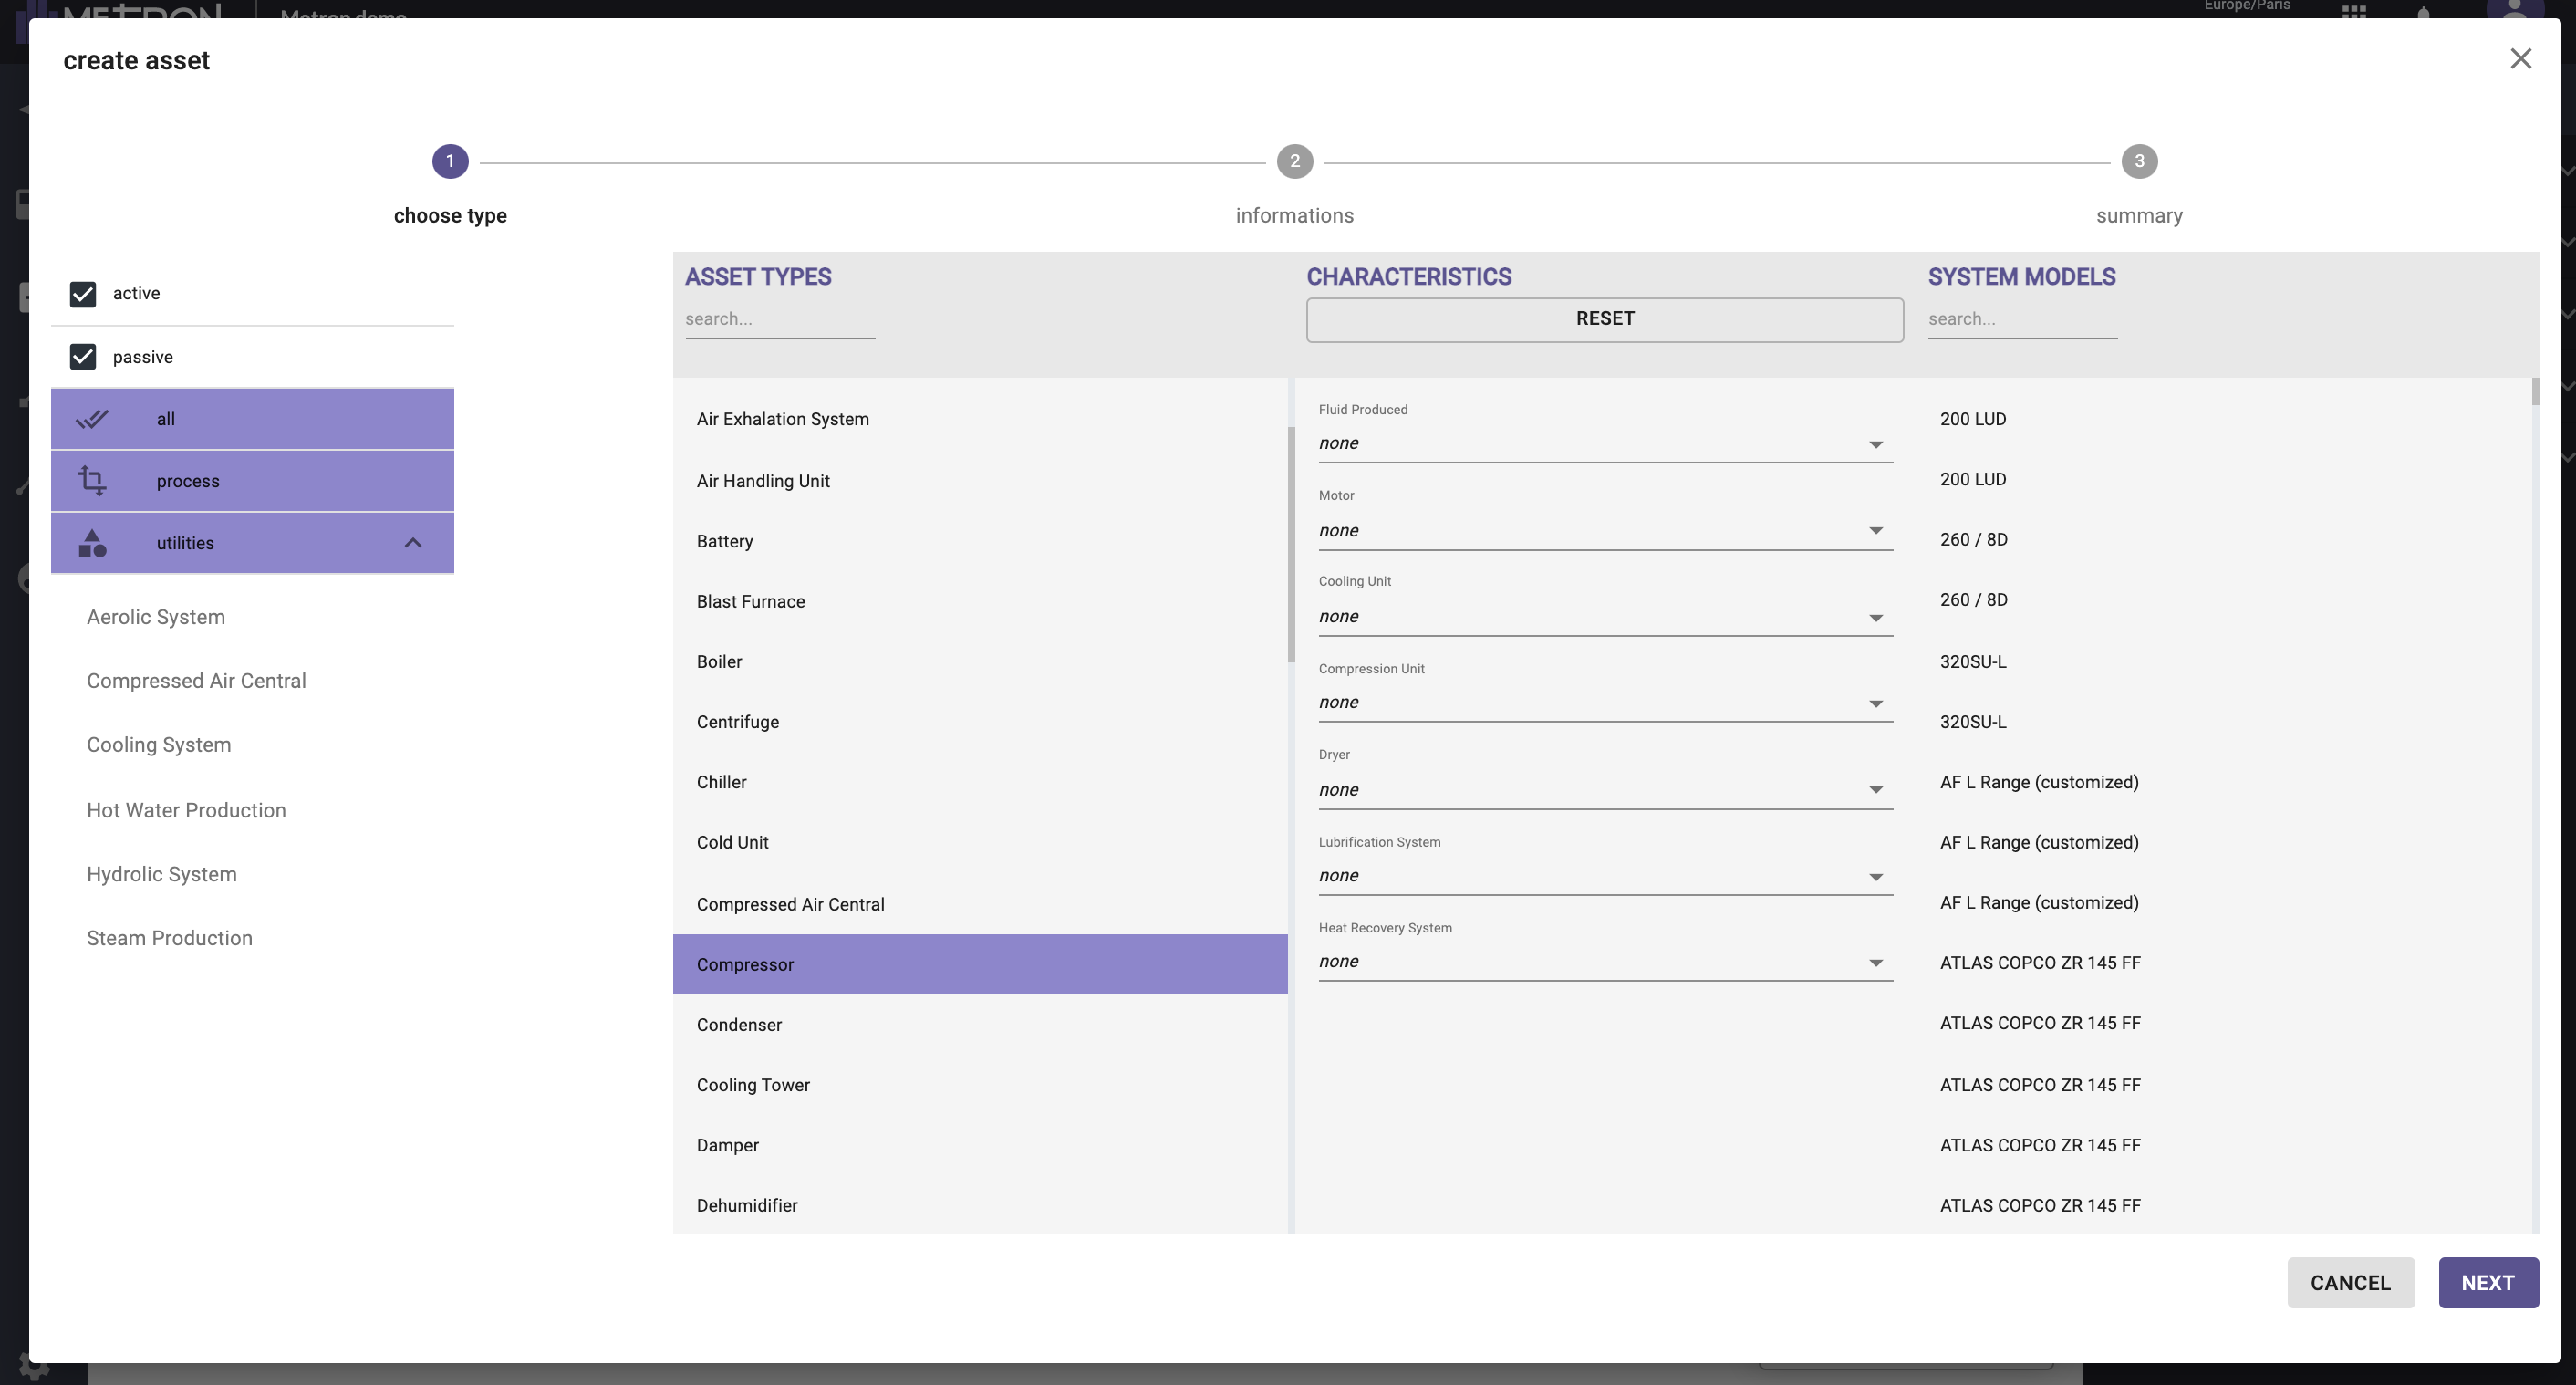
Assets can be active or passive (if it consumes energy, an asset is active, else it is passive). Assets can be associated with a utility or to a process.
Once you have selected an asset, you can define it more in detail by:
- Choosing the main characteristics of this asset (the system models list is updated with the selected characteristics)
- Choosing directly the system model if it is known (the characteristics will be automatically filled in with the information of the chosen system model)
Once created, general information about the asset can be found directly by clicking on it in the upper part.
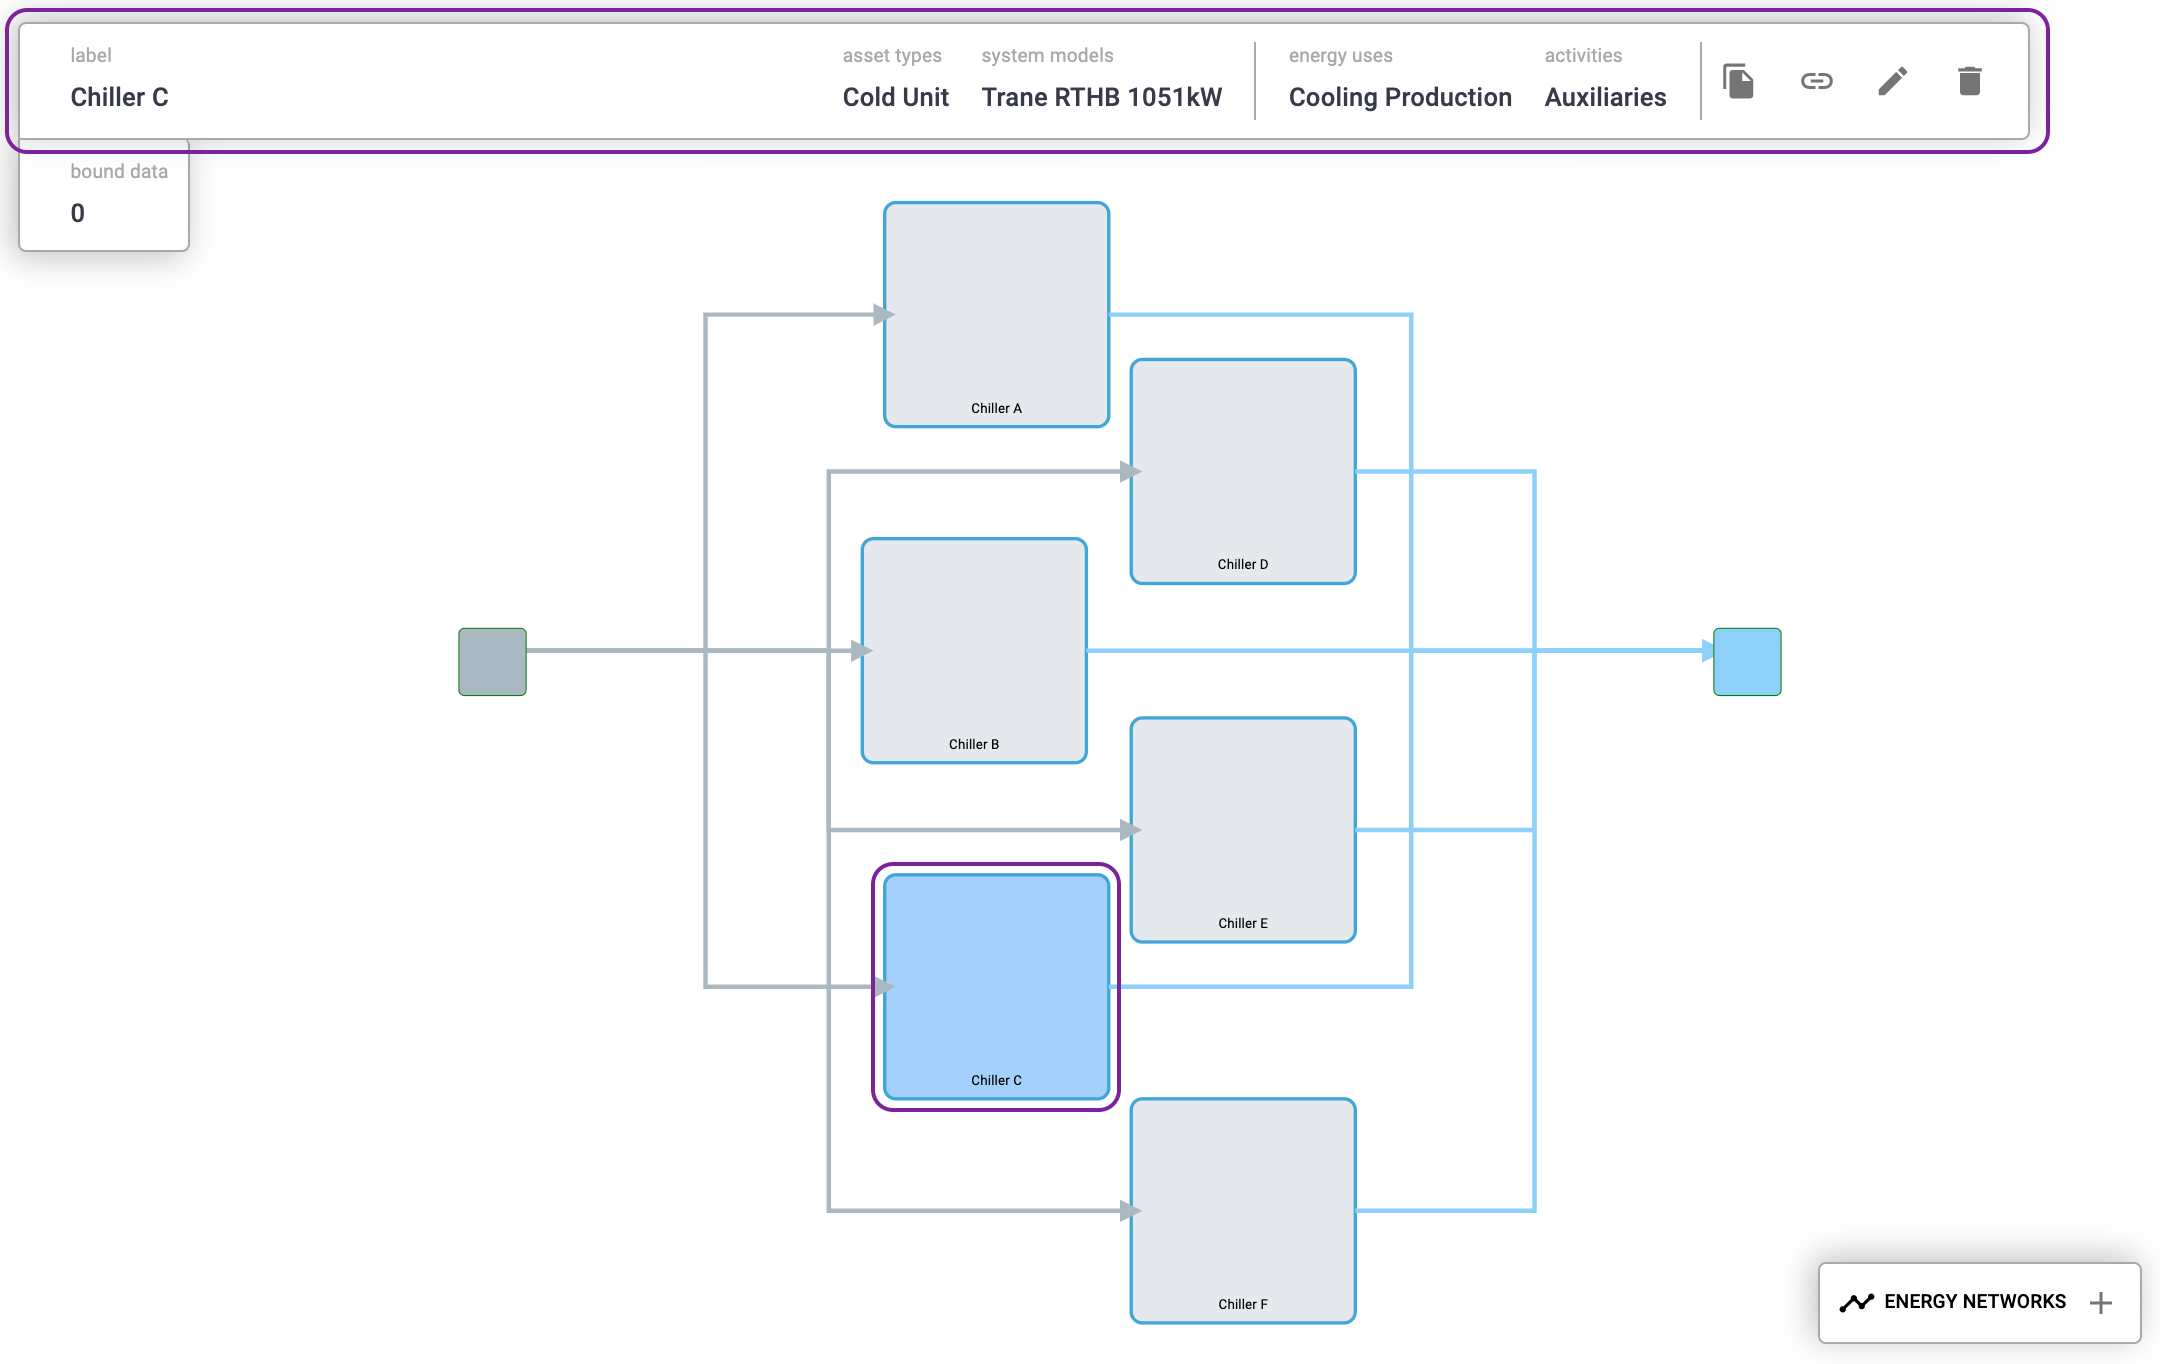
3. Create an energy network tool
The energy networks refer to the vectors that feeds, pass through or are produced from the assets. Examples of energy network types are:
- Network Combustible: gas combustible, solid combustible (e.g. coal, natural gas, fuel oil, biomass)
- Network Electricity: alternating or direct current. (e.g. electricity from the grid, electricity from distinct providers, auto/co-generation)
- Network Production: gas production (e.g. CO2 subproduct), liquid production (e.g. water production), Piece production (e.g. units produced), Solid production (e.g. kg of production).
- Network Thermal Energy Vector: Gas Thermal (e.g. steam, compressed air, exhaust gas), Liquid Thermal (e.g. chilled water, hot water, liquid ammonia), Biphasic Thermal (e.g. R-134A).
The existent Energy Networks are shown as squares.

This square can then be linked to any asset by the energy distribution feature
4. Create energy distribution tool
It is the link between assets and energy networks. To create a distribution link, hover your mouse over an equipment, perimeter or energy network until a green square appears. Click on it and hold the click towards the object you want to connect it with. A link will then appear between your two objects.

5. Create energy use tool
Allows you to define the significant energy uses that will be shown in the Energy Management and the Data Visualization workspace
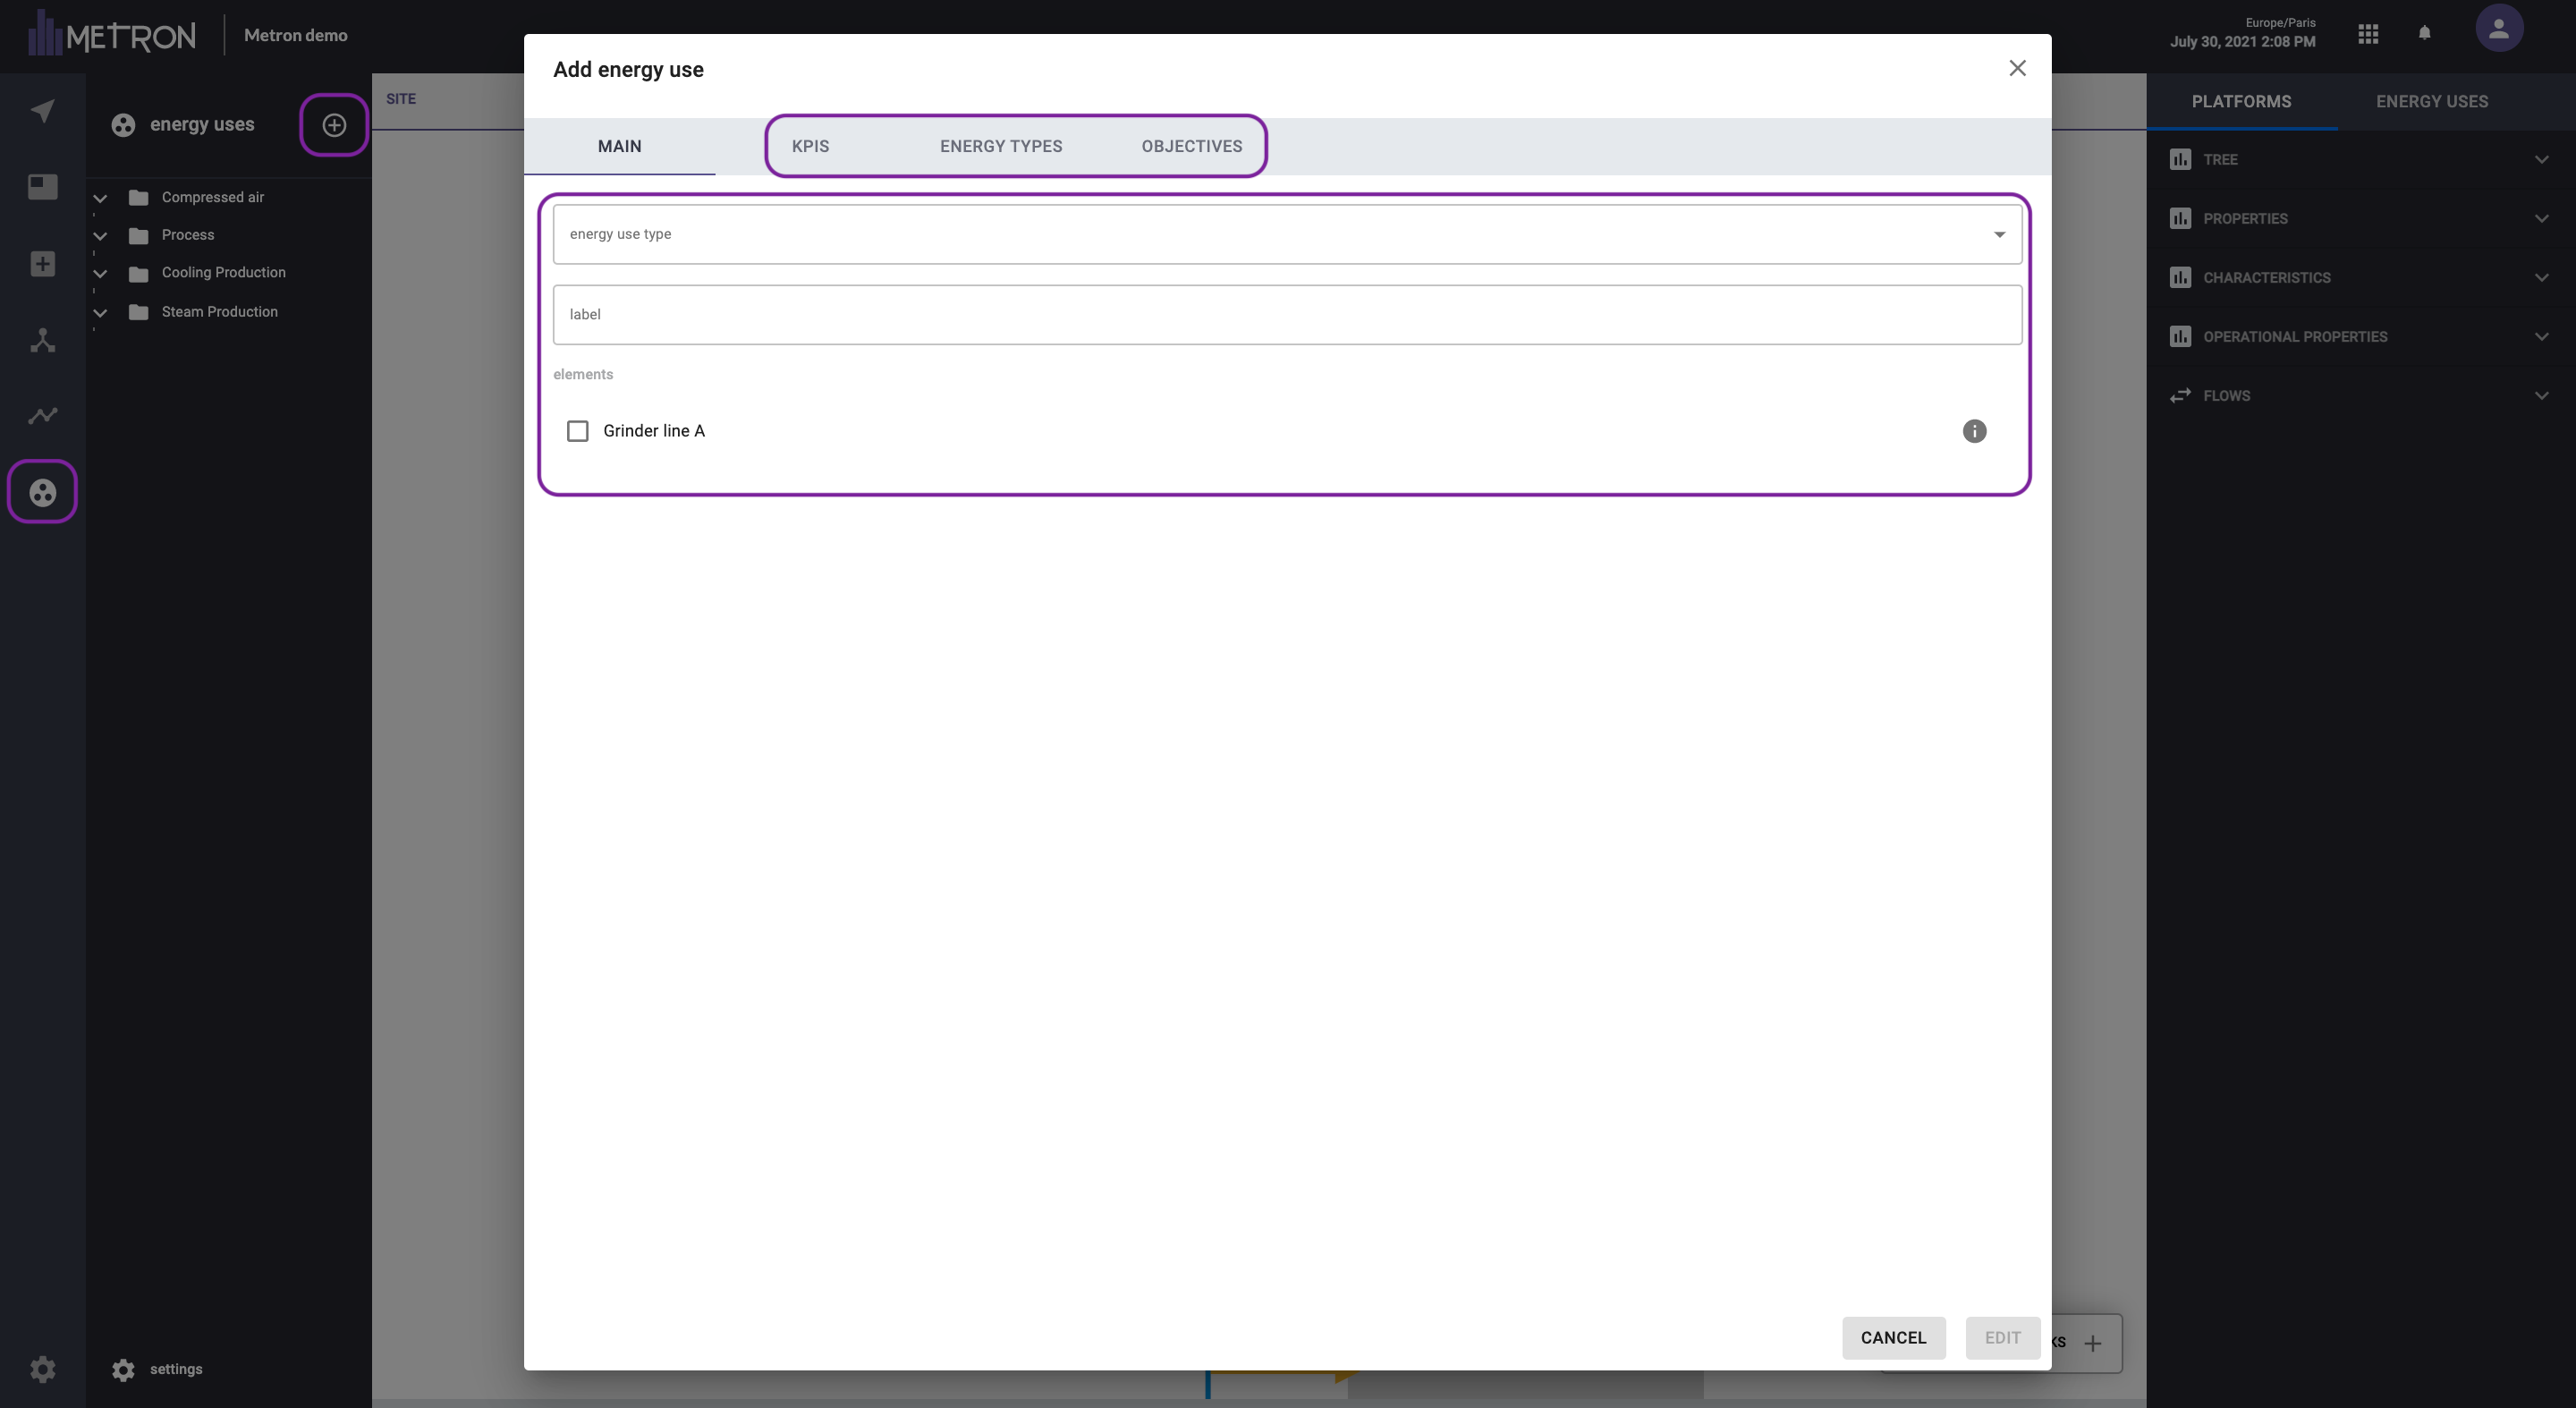
An energy use allows you to conceptually regroup assets that have the same function in terms of production. Could be compressors, cooling system, wastewater treatment plant, ...
To create an energy use, first you have to press the “+” button in the energy use menu. Then, we will be able to fill in the information about the new energy use:
- Energy use type: to be selected out of a list
- Label: Personalized name of the energy use
- Elements: assets of the mapping that conforms the new energy use
You can also complete the information on KPIs, Energy types and objectives.