 The upper part of the grey area on the left of the METRON ENERGY MANAGEMENT (JOOL) window contains the analysis selector. This is where you can choose which tool to use and which analysis to display in the main working area.
In this analysis menu, one can find dashboards (composites of several widgets), individual widgets or Xtabs (fixed data tables) that the administrator has decided to make available to users.
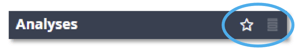
The small logos at the top right of the area allow the analysis selector to be used in two different modes: the star leads to the "favourites" mode and the table leads to the "full" mode.
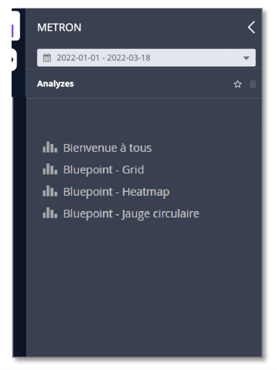
Favourite mode
Lists only those analyses that have been marked as "favourites" for the logged-in user.
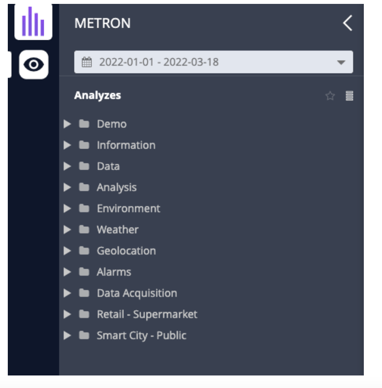
Full mode
Lists all analyses to which the logged-in user has access.
These analyses are grouped in directories whose structure is defined by the METRON ENERGY
Whichever mode you choose, clicking on any of the analyses will run it and display the result in the main work area. If this work area was already occupied, the currently displayed results are minimised in the history pane and replaced by the new results.
If the work area was split to display multiple results, the new analysis pushes the tools already displayed and the oldest is minimised in the history pane (first in first out).