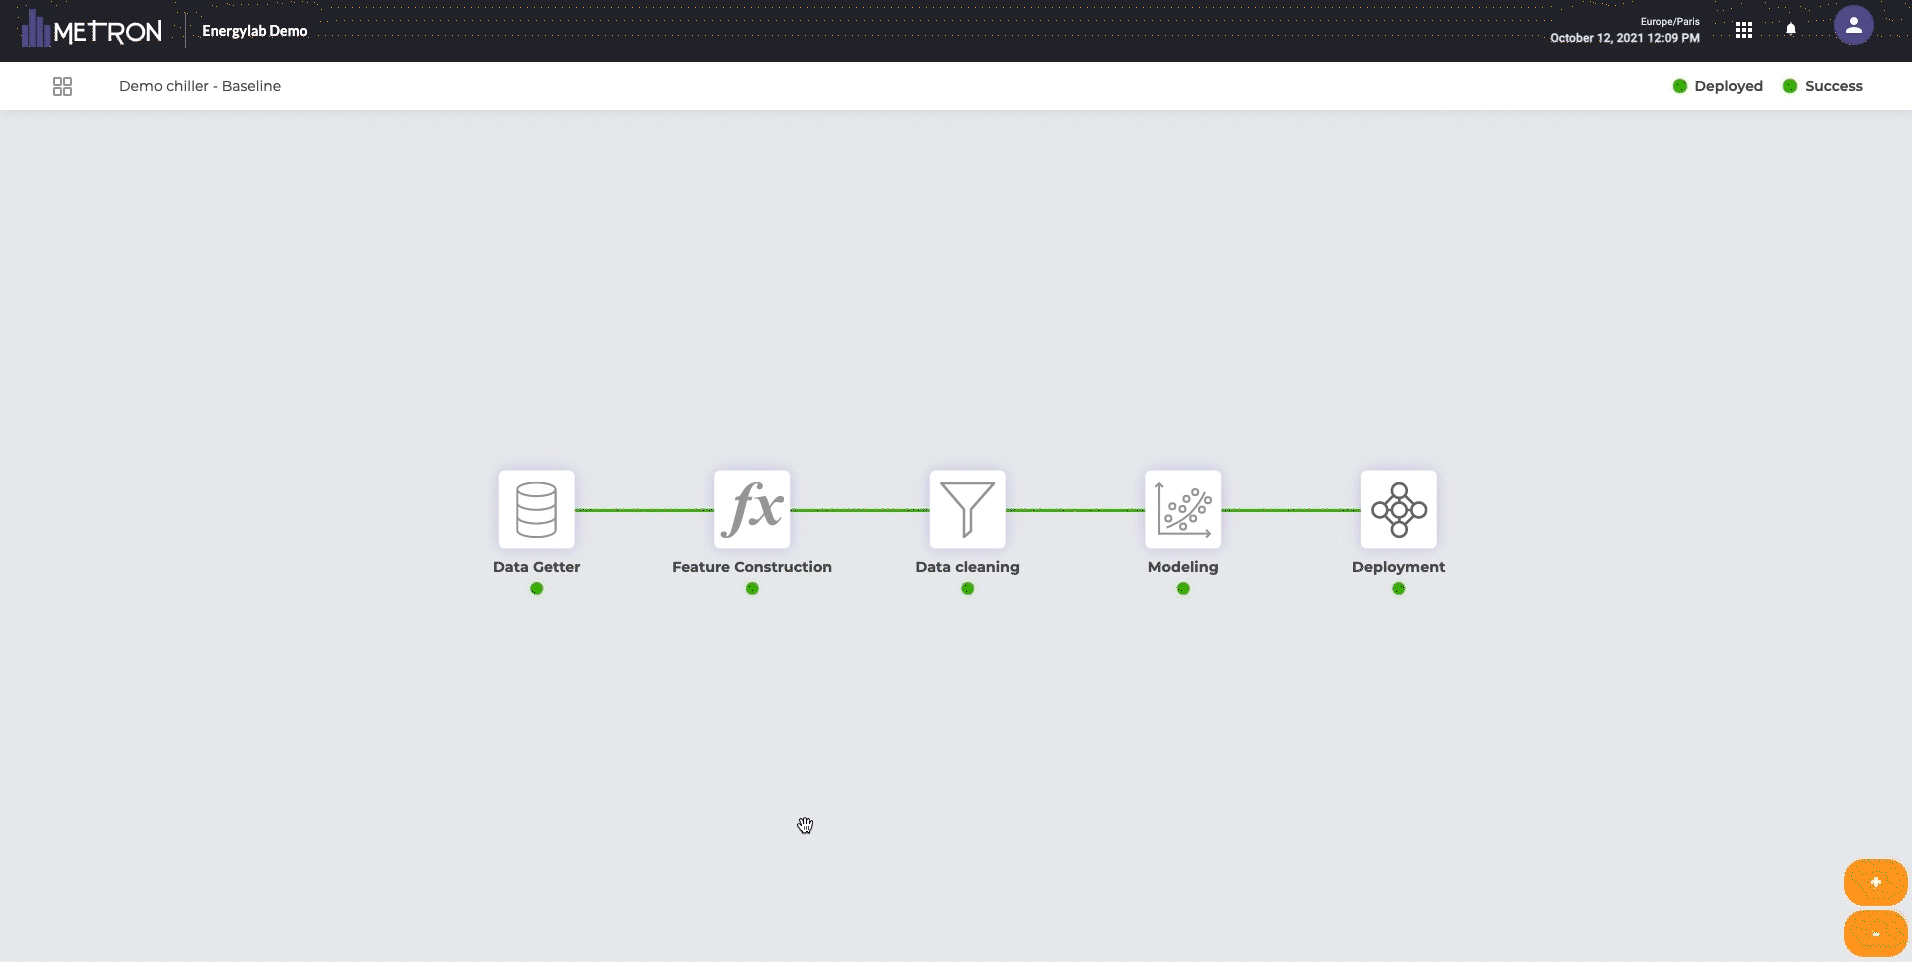
General information about blocks
Block status
A block has a status indicator that represents its current state. The possible statuses are:
-
Waiting: The block is waiting for data or user input
-
Processing: The block is currently running
-
Fail: The block has failed to complete its processing
-
Succeed: The block has successfully processed the data
This status can be seen from the global workflow view, below the processing block, or from the top right of its configuration panel (see below).

Link between block status
If a block fails to process, all the following blocks will fail as well. All blocks should be in the “succeed” status to be able to deploy a model.
Correlation matrix
In every block (apart from the “Deploy” block), a correlation matrix is available on the bottom left angle. It will display the correlation between all variables from the block's input data.
Initial workflow
Every new workflow created will be initialized with a “Get Data” block, since every workflow needs data. It is not possible to add another “Get Data” block.
Blocks management
Add a block
To add a block to a workflow, simply click on the “+” on the left end of your workflow.
Edit a block
To edit a block, simply click on it. It will open a window to configure it. You can fill/edit the different fields. You can “Cancel” or “Apply” once this is done. Important note: Nothing will happen to your data until you click on the “Apply” button of your block.
See “The different types of processing blocks" for detailed information about each one of them.
Delete a block
To delete a block, simply click on it and click “Delete” on the bottom left corner. A confirmation message will be prompted. Important note: This action is irreversible. Also, if you delete a block, all following blocks will be deleted too.
Visualize block data
To get a quick overview of the data for each block (except the "Deployment" block) you can click on the eye button on the top right corner.
You will be able to visualize your data in a graph or in a table, by changing the chart type in the right column.
Approximation method
In certain cases, you may have too many points to display in the preview window. Therefore, in order to ensure an optimal viewing experience, Energylab will purposely display fewer points using approximation techniques. This guarantees the best performance for all of your interactions on EnergyLab.
When the approximation method is used, you will be warned with an icon and a message.
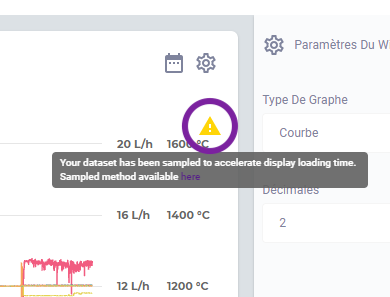
The current method returns the points at a fixed time frequency which is higher than the original one. For instance, if you selected a data point frequency of every ten minutes originally, EnergyLab may only display a data point every hour, warning you with the /!\ symbol.
N.B: If you did not set any data frequency in the "Data Getter" block (none/none aggregation/interpolation), EnergyLab will automatically keep a point every x points sequentially. For instance, it will return a point every four points.