Introduction
The Data Visualization workspace is dedicated to the creation of dashboards.
The environment is classified into:
- Projects and Pages: first level of classification. The workspace is composed of pages created by users, which are each assigned to a specific project. Once a user creates a page, they are automatically assigned as owner and can thus manage the permissions to the page they have created through the Manage permissions menu.
- Sections: second level of classification. Each page can be divided into sections. Sections are composed of widgets. Different types of widgets are available in order best to display the relevant data for specific project, to follow-up or to explore your data.

Navigation - Main menu
- Project menu: to view, duplicate or delete created pages. To edit, duplicate or delete a page, simply right-click on the page name and choose the desired option.


- Page menu: to view and modify sections order of your page. To view a section, click on its name and you will be redirected to it in your page.
To modify the location of the section in your page, hold and drag the section name in order to move it to the desired position.
- Project organization: when creating a new project you can select its "energy use" and its "folder". The energy use has been previously defined in the Mapping workspace while the folder has been created in the Data Visualization workspace.
- Page creation button
- Folder creation button
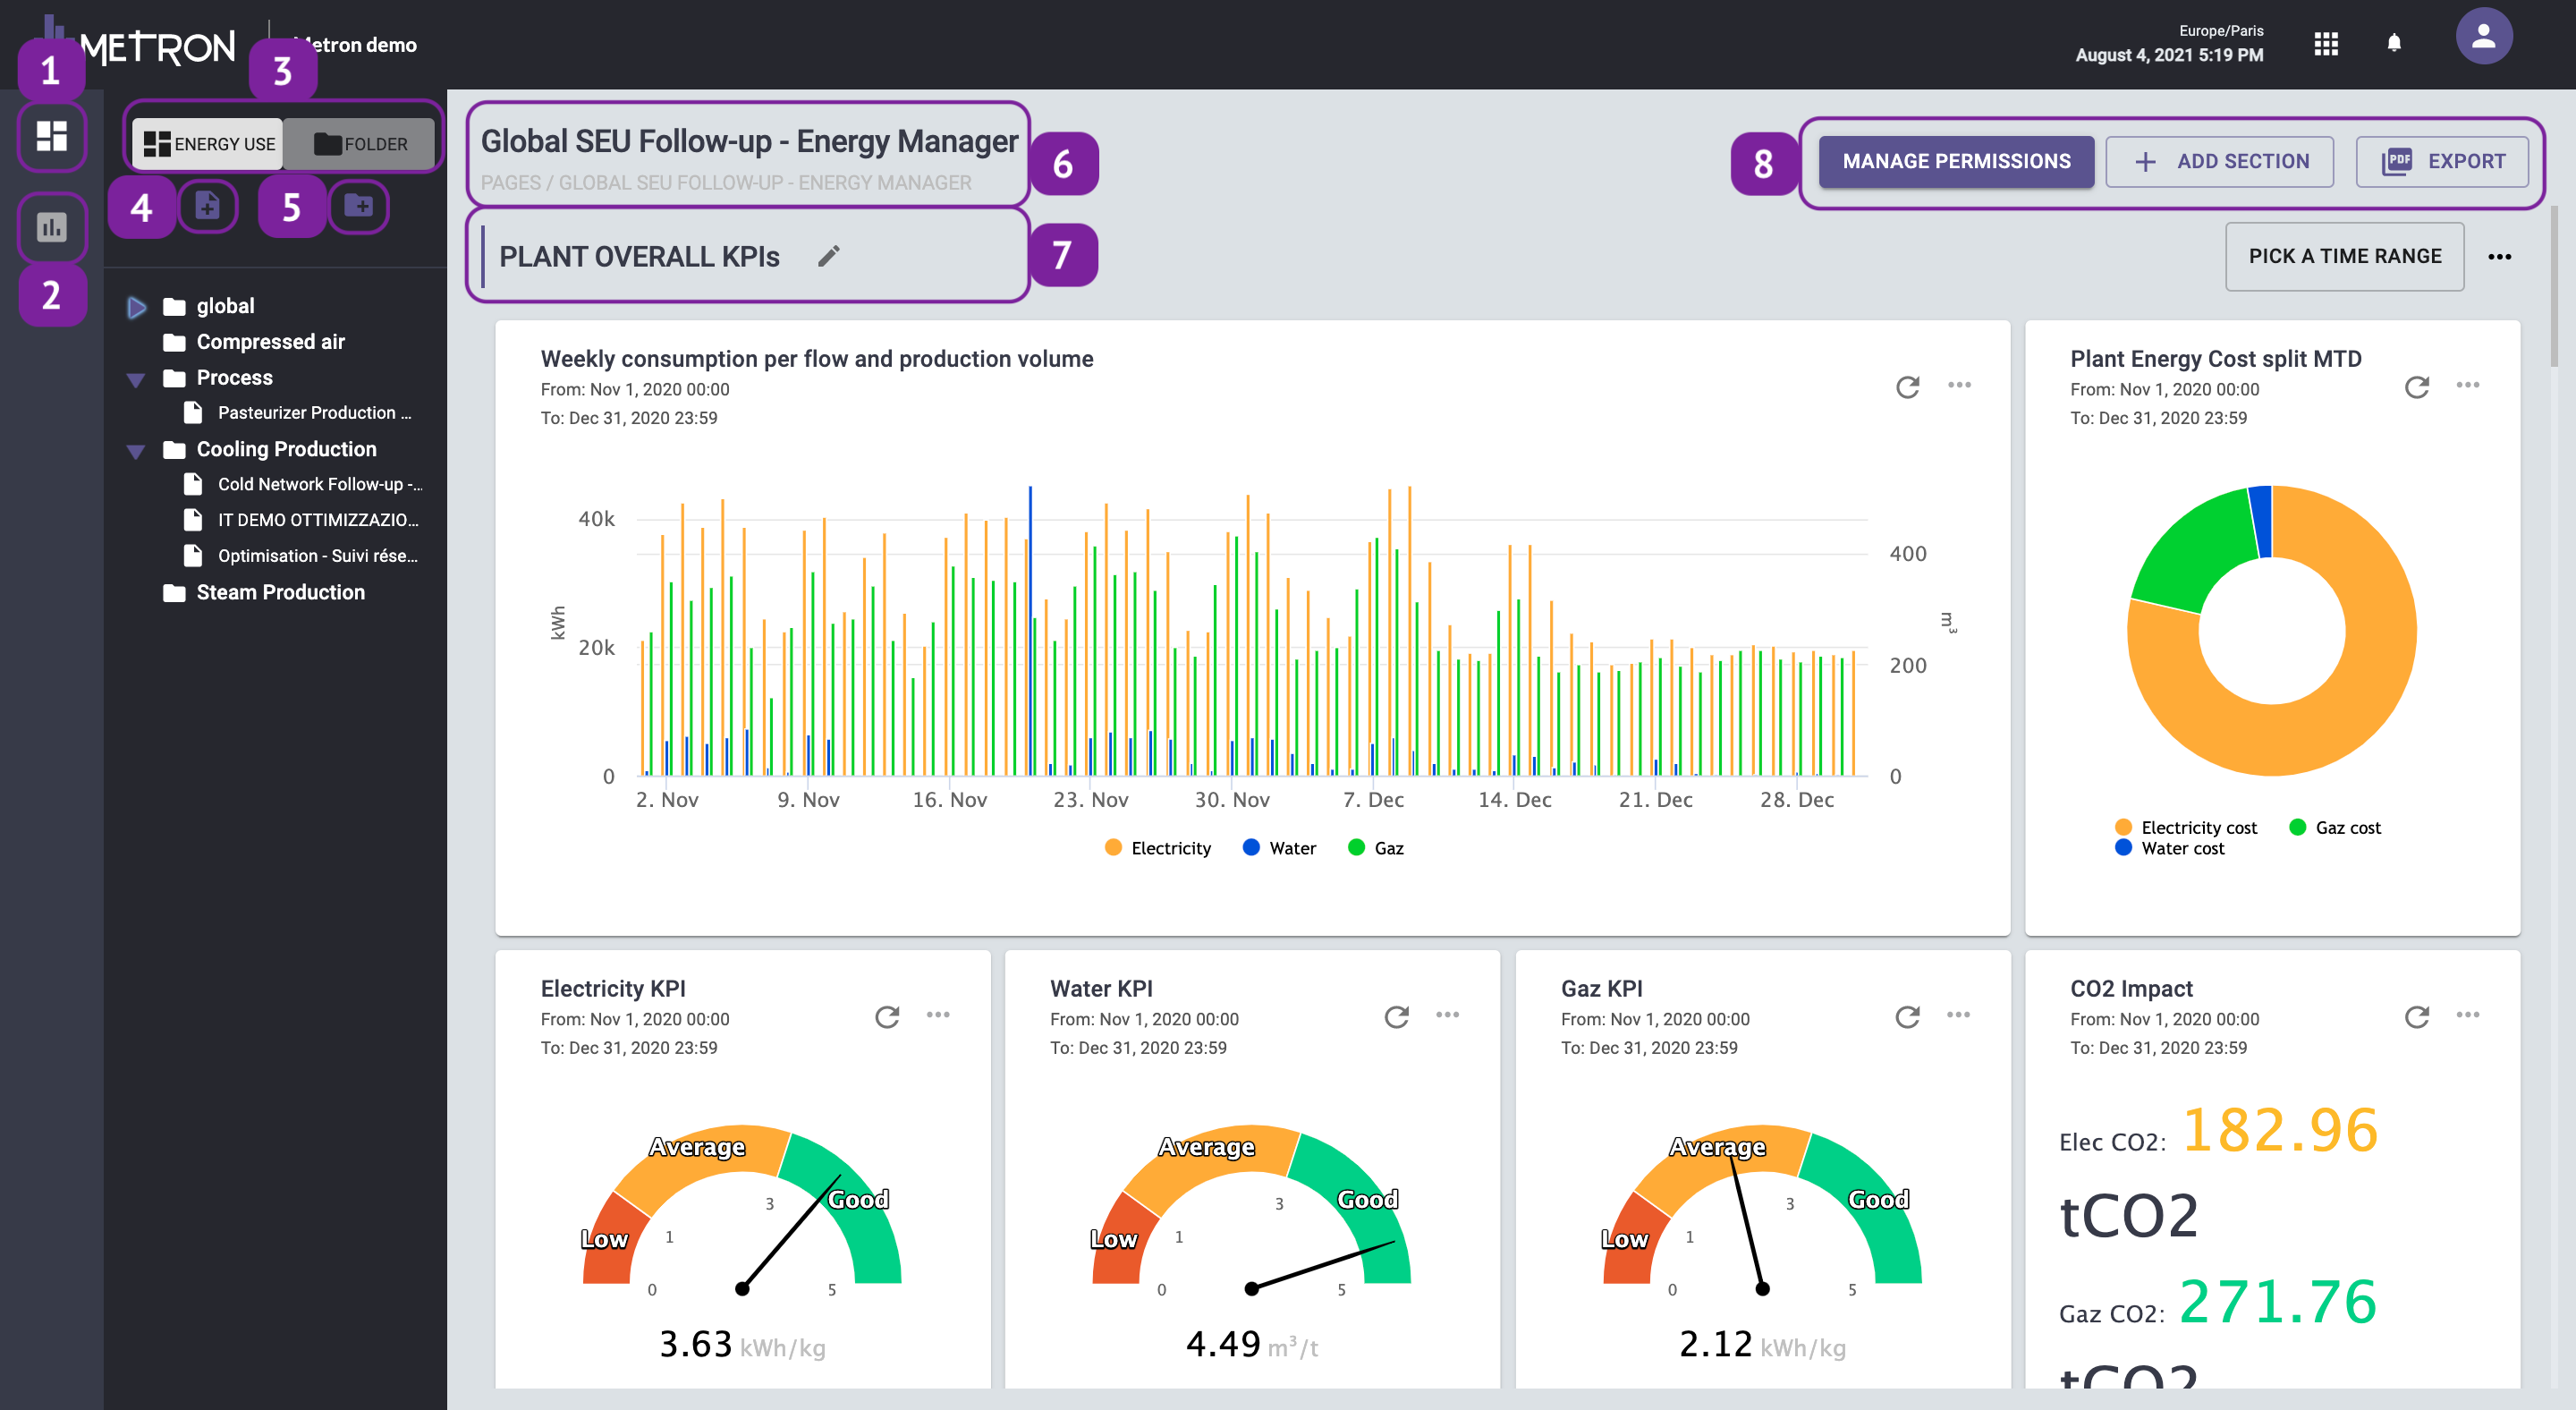
- Name of the project/page created
- Name of the section added to the page
- Actions of the page:
- Manage permissions: to manage user access to your page (see article)
- Add a section: to add a new section to your page. It will be automatically added at the bottom of the page
- Export: to export your page in pdf (see article)
Navigation - Page
For each project, a fully customizable page with a dashboard will be available with multiple widgets, organized by section.
For each section of the page, the following options are available:

1 - View data from a specific time range
Select a time range to display the selected data for all widgets in this section.
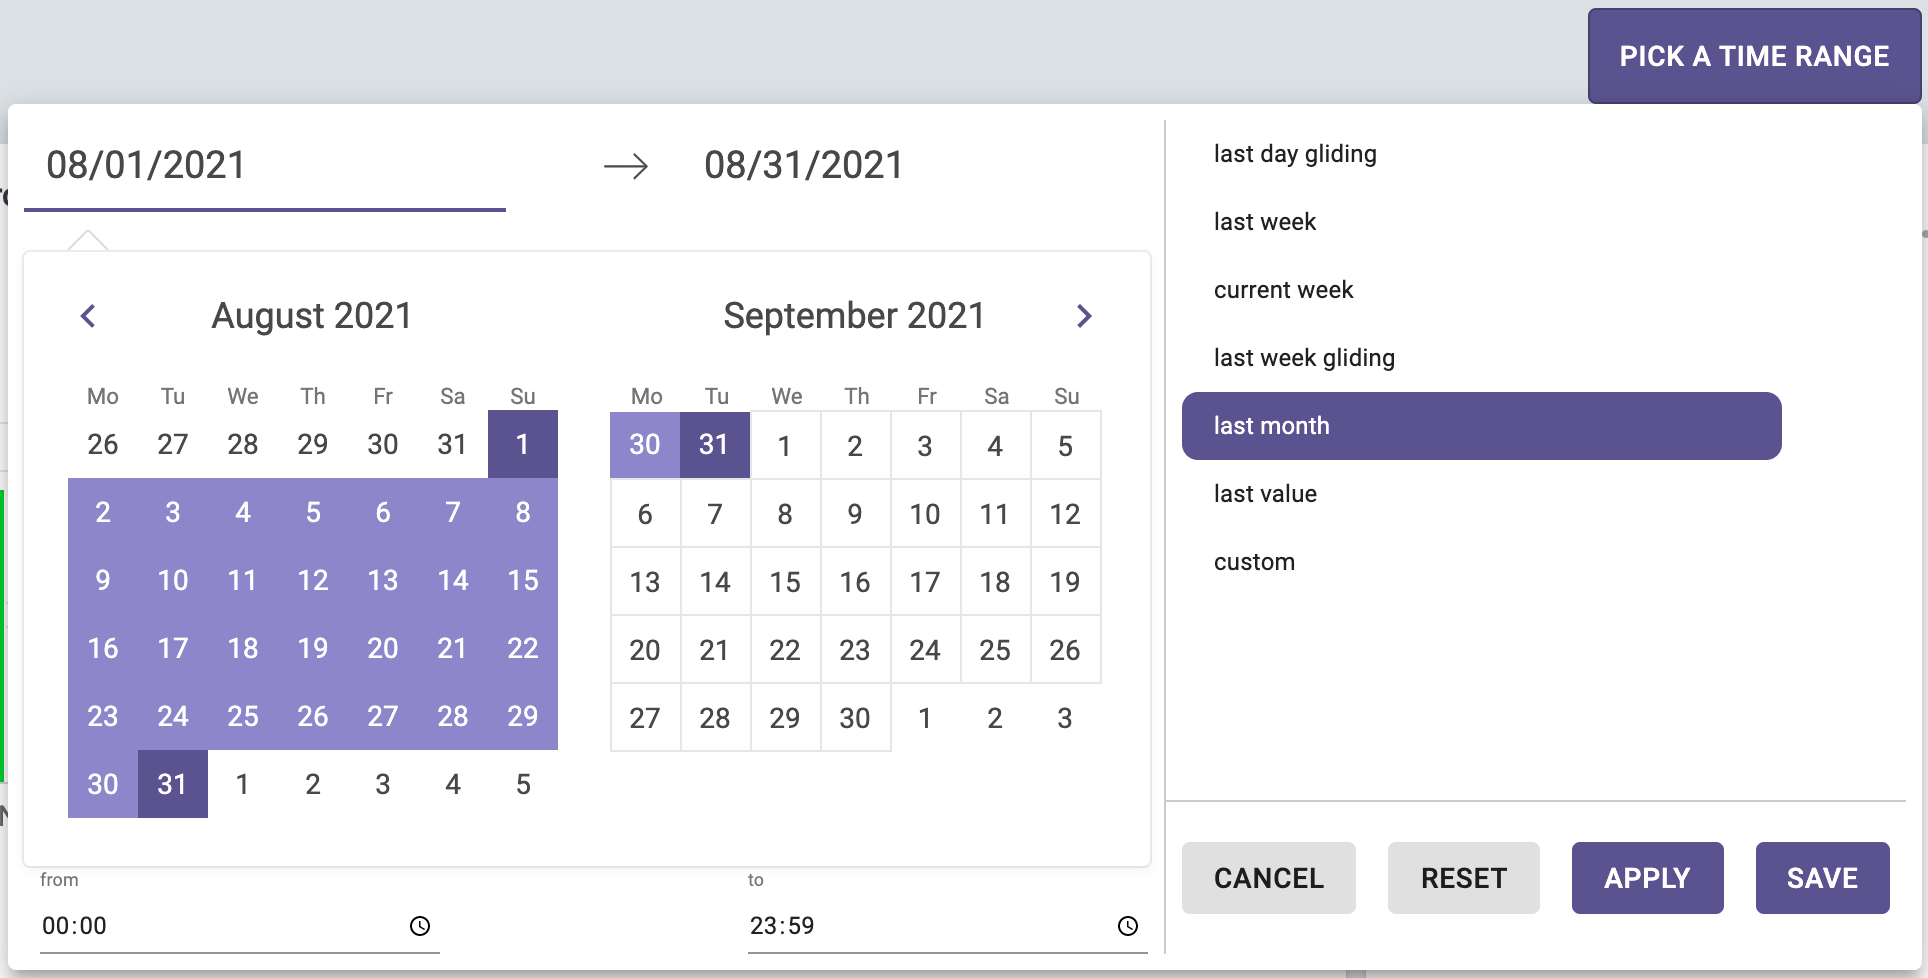
Once you have selected the time range:
- Click on apply to view all of your section's widgets over the chosen time range. This will not overwrite the viewing settings for the widgets, as they will be reset once you log out of the platform. If you would like to view your data in this time range permanently, you can click on save and this will overwrite the widget viewing settings for the entire section
- Click on reset to stop applying the time range selection filter on your section (the widget viewing settings will be applied again).
- Click on save if you want to overwrite the viewing settings of all section's widgets and apply a new time range permanently (visible even after logging out of the platform)
Attention: by clicking on "save", the selected time range will be applied to all users.
To save time when creating your page and to avoid having to set up the time range for each of your widgets, we recommend that you first add all the widgets of your section and then select a time slot applicable to all of them and click on "save".
2 - Section actions
-
- Add new widget: access the widget selection menu.
- Paste widget: paste a widget you have copied in any pages or sections
- Update section layout: modify the size and the position of the widgets in the section.
- Delete : to delete the section