New dimensions available for the scatter plot widget

You can now take your scatter plot data analysis a step further by adding new data to observe, such as :
- Variation in the color of points displayed,
- Variation in the size of points displayed.

Simplified choice of period to observe in Visualization space

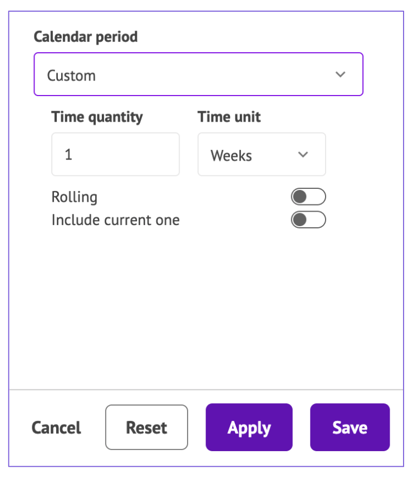
To change the period to be observed in the Visualization area, click on the "calendar" icon in a widget or dashboard section. This step has been simplified:
New look for the add new widget panel
