New features and improvements in the Visualization workspace
New functionality: Bulk Edit
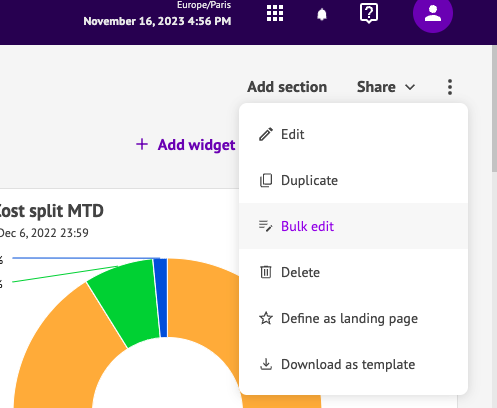
The same data source is often used in several widgets within a single dashboard.
By clicking on the new "Bulk Edit" button, a window opens with all the tags requested in the dashboard. You can replace one tag with another, and this change will be applied to all the widgets in the dashboard:
Excel export of curved widgets
Before exporting a curve widget to Excel, you can now configure:
- decimal separator: point or comma
- thousands separator: none, space, comma, dot
- time format:

Access the Privacy Policy at any time from the platform
The link to the Privacy Policy has been added to your platform's top-left toolbar.

New and improved features in EnergyLab
New: residual analysis
Residual analysis allows you to test the quality of models created in EnergyLab and identify potential areas for improvement. It identifies trends that the R2 doesn't see. Where R2 will tell you just 3 values about model quality, residual analysis will show you a large number of points.
To find out more, read the article Residual analysis on EnergyLab.
Cross-validation to improve your models
In the modeling stage, you can now view the results of 4-fold cross-validation to estimate much more finely the reliability of your model through sampling.

Enhanced table preview
At any stage in the construction of your model, when you wish to preview it in table mode, you can adapt the size of the columns: