
[NEW] Data Connection Alarms - Alarms
A new interface is now available in your platform to let you configure your alarms, for yourself or your collaborators, to be informed directly by email in case of any data connection issues from your any of your tags.
From the Alarms workspace, open the new tab "Data Connection Alarms" and start creating your alarm by:
- Selecting the tag you want to set an alarm for
- Giving it a name which will appear in the list of all the alarms created in this workspace
- Setting up the notification period (hours or days) after which the email will be send
- Listing the subscribers, the person(s) to notified by email
This new feature allow you to track any connectivity issue with your tags and better understand any data displaying issue you might encounter on your dashboard.
Landing page option - Data Visualization
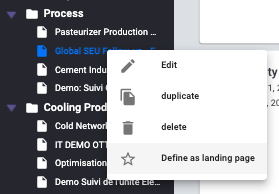
From the page manage menu, you have now the ability to setup a particular page as the default landing page when you log into your platform. Simply click on "Define as landing page" and the star icon will then be filled. To remove this option, click again on it, the star will then be empty.
Note that each user of your platform can define their own landing page. Only one page can be set up as a landing page per user.
Export tags list - Data Sources

A new option is now available in the Data Sources workspace: "Export tag list". This option will allow you to export all your qualified and calculated data into excel files. You will get the complete list of the tags with their name, tagpath, unit, creation time, type, etc.
For now the extract can be download in two different files (one for the qualified series and another one for the calculated series) but this will be change soon in a one excel file download, including two tabs.
Data preview - EnergyLab
You can now get a quick overview of your processing block data for each block in EnergyLab (except the "Deployment" block).
Click on the eye button on top of your block (as below)
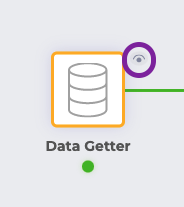
You will be able to visualize your data in a graph or in a table, by changing the chart type in the right column. You can also change the decimal value for more precision.
Other improvments
- Batch qualification for "Data Science Unqualified" data: you are now able to qualified in a simple manner all your "Data Science Unqualified" data in batch mode or CSV to save you some time
- Direct access to the Resource Centre and Service desk: you are now able to access to our new Help Desk and Resource Centre directly from your platform by clicking on the "..." button in the top right corner of the platform.