New button for reorganizing your dashboard sections
On your METRON platform, dashboards are called "pages".
These pages are made up of different sections, which in turn are made up of different widgets.
You can now easily reorganize your dashboard sections by clicking on "..." at the top right of each section:

Percentage change counter
You can now swap the colors of your counters' percentage change:


Possibility of creating user notes with the viewer profile
Users without editing or dashboard creation rights on the METRON platform can now add user notes to curve widgets.
As a reminder, to create a user note, simply click on the desired location on the widget.
.png?width=688&height=304&name=image%20(1).png)
Template-based dashboard creation: automatic calculation of calculated series


When you create a dashboard from the "Global site energy report" template, all you have to do is enter the source data. Calculated data are created automatically to feed the right widgets:
- KPI gas = gas volume consumption / site production
- KPI water = water volume consumption / site production
- KPI electricity = electricity energy consumption / site production
- Electricity cost = electricity price * electricity energy consumption

Energylab
- Data sources with special characters in their names can now be used in EnergyLab.
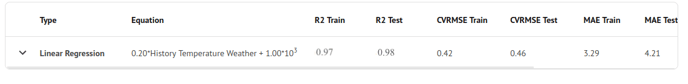
- Linear model equations are now displayed in scientific notation to make coefficients easier to read:
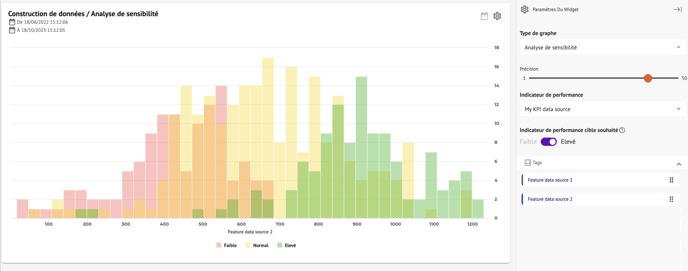
- New data visualization tool : Sensitivity analysis (more information to come)