The main points
At the modeling stage of your model, you can perform a residual analysis in addition to an R2 analysis to identify improvements to be made to your model.
Residuals allow you to identify trends that the R2 doesn't see. Where the R2 will tell you just 3 values about the quality of the model, the residual analysis will show you a large number of points.
Examples of insights that residual analysis can help you identify:
- Outliers that impact model results
- The need to create intermediate series (e.g. polynomial)
- Lack of points
- Drifts in data behavior.
Example of residual analysis of an acceptable model:

The points are randomly and symmetrically distributed around 0. The model is therefore correct.
Example of residual analysis of a non-acceptable model: 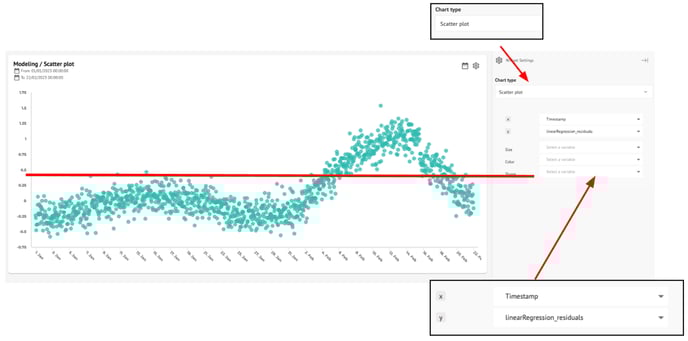
Here we see that the residuals are not randomly distributed. This indicates an auto-correlation problem that can be resolved, for example, by creating new constructed data.
Need to learn more?
If you need the complete document explaining the residual analysis on EnergyLab, please ask your Project Manager.