Introduction
Through the Mapping, you can identify the tags related to your system in general: equipment, thermal/energy flows, energy market, price, etc.
Once contextualized, your tag will be visible:
- From the Mapping workspace, in the right-hand column, in the different categories referencing your site projects or energy uses: trees, properties, features, operational properties, flows.
- From the Data Source workspace, in the "Elements" column of your tag. It is also possible to modify the contextualization of your tag directly from the Data Source space, by selecting the perimeter or the energy use associated with your tag in the tree structure of your site.
Identify your contextualized data
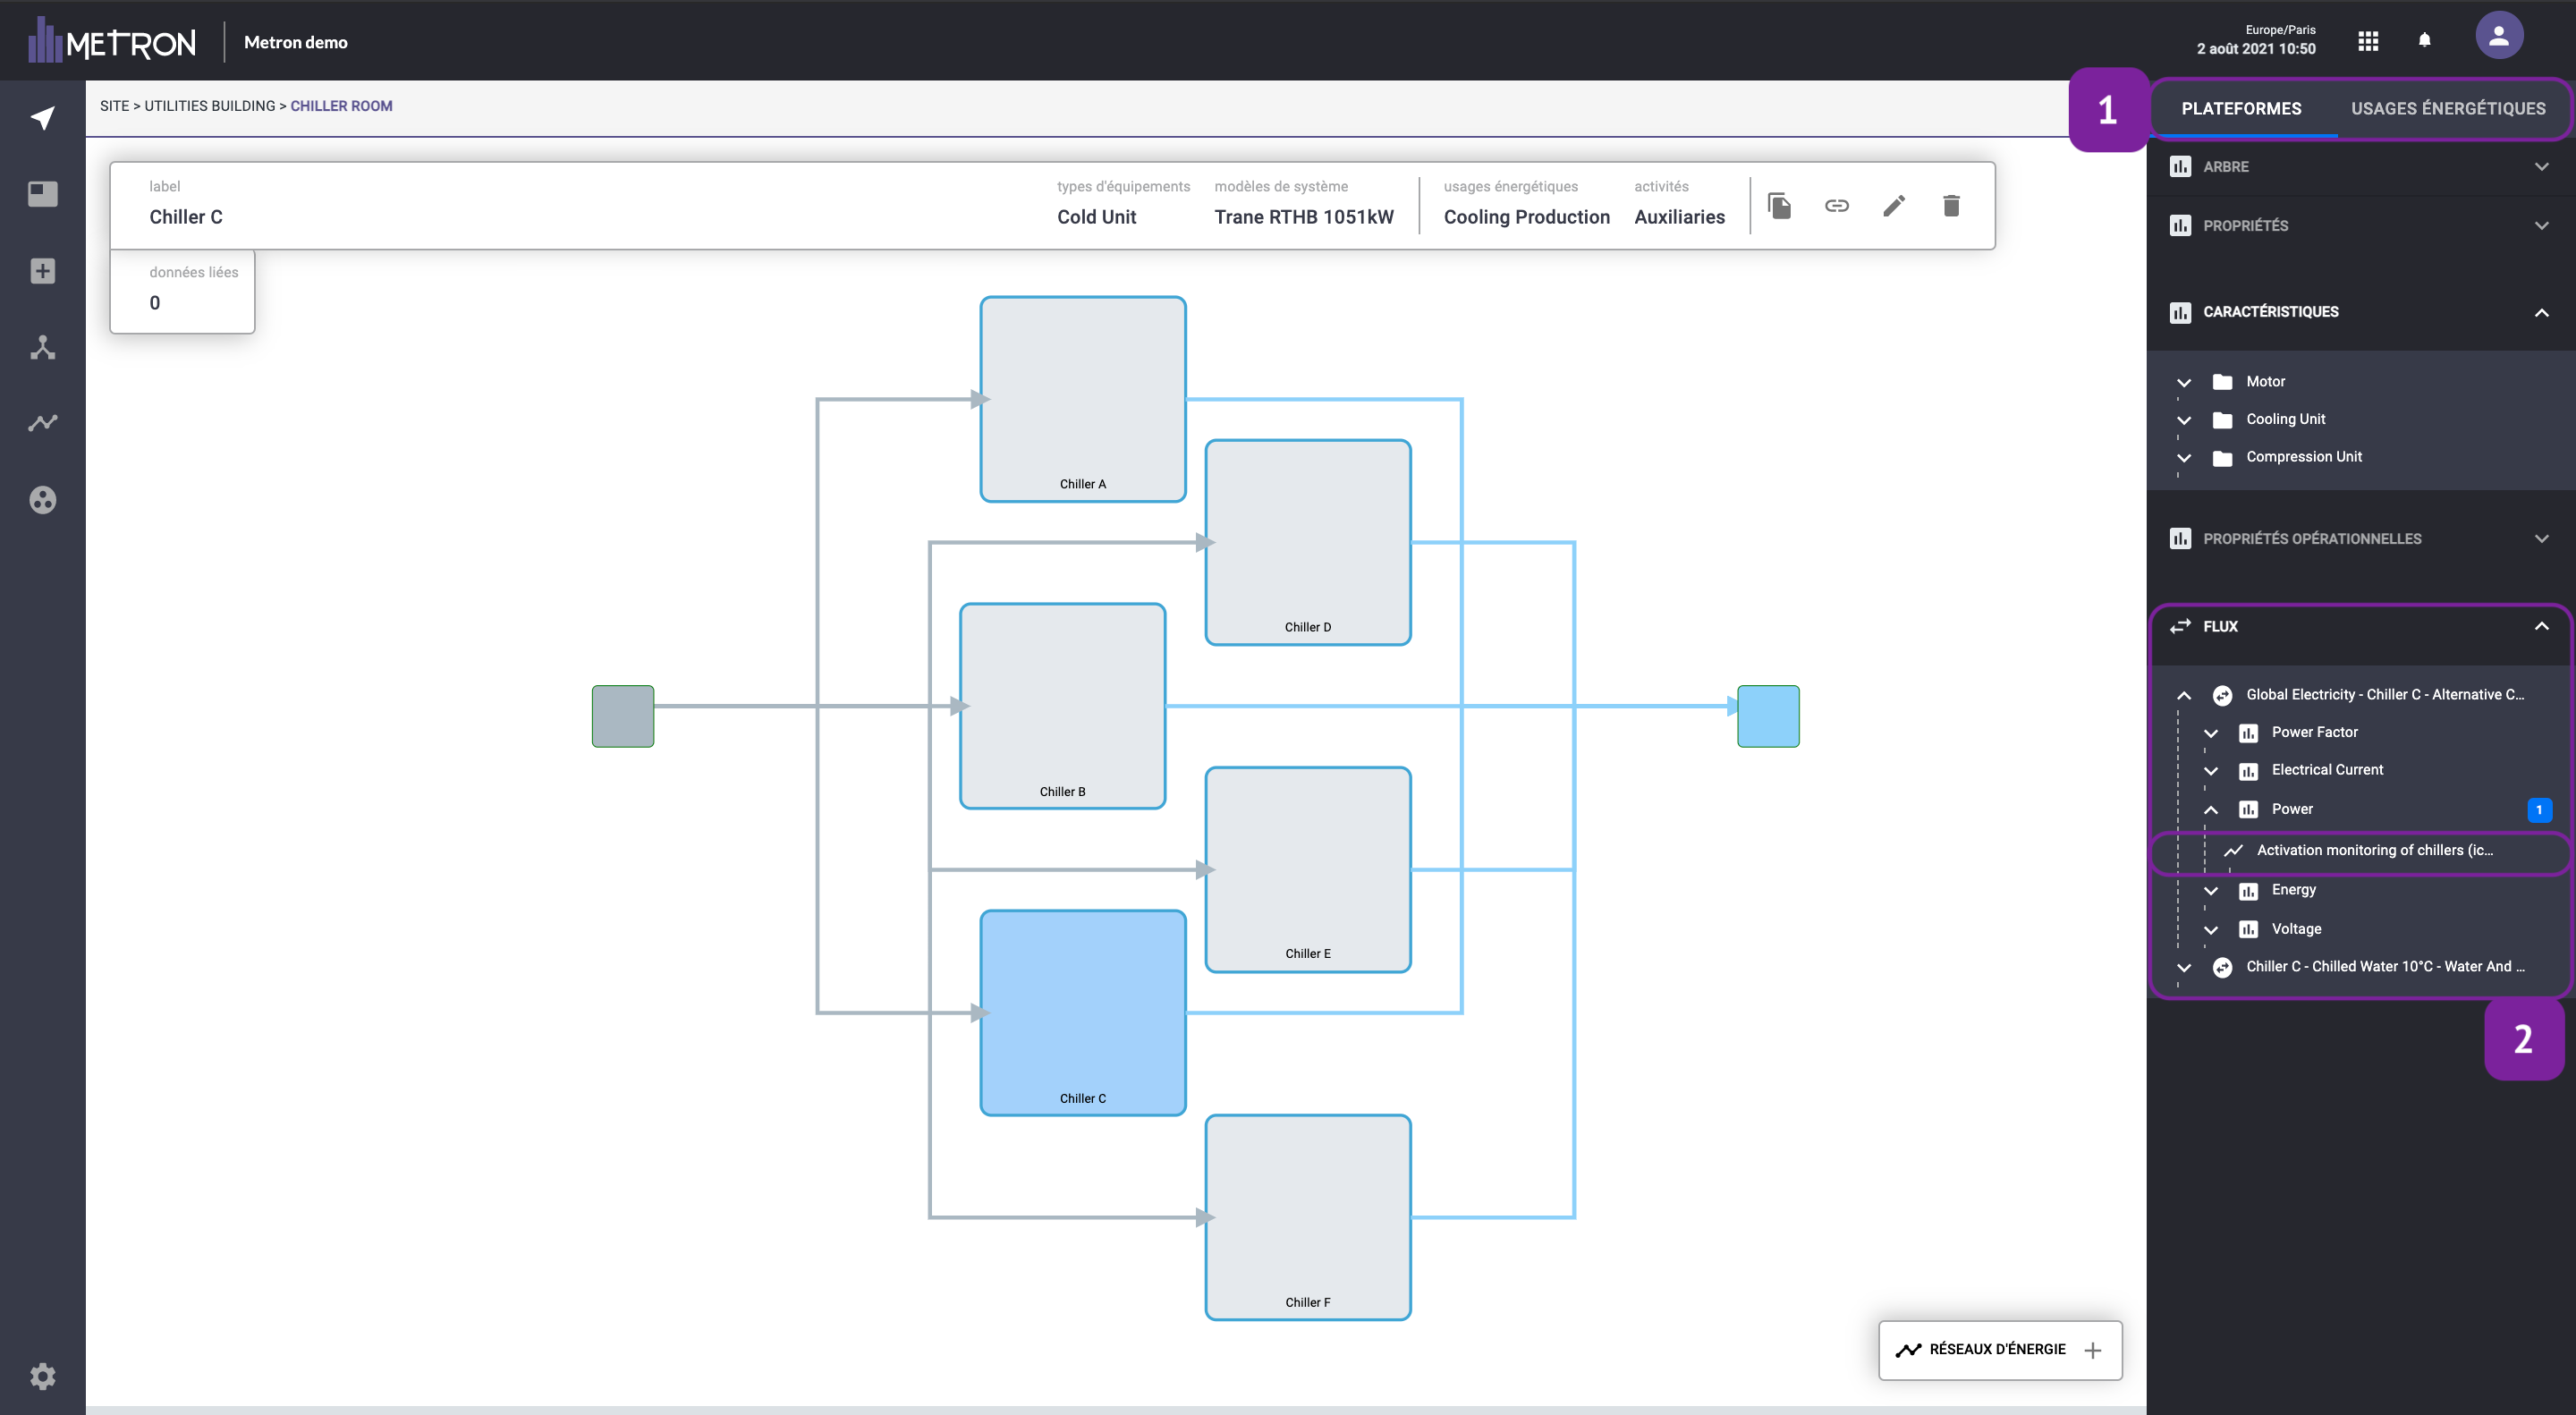
In the right panel of the Mapping workspace, you can identify your contextualized tags:
- Ordered in your site's projects or significant energy uses folder
- Associated to the perimeters, equipments, flows and characteristics assigned previously in the Data Source workspace
- A blue bubble with the number of tags linked to this property will appear with the tag names associated
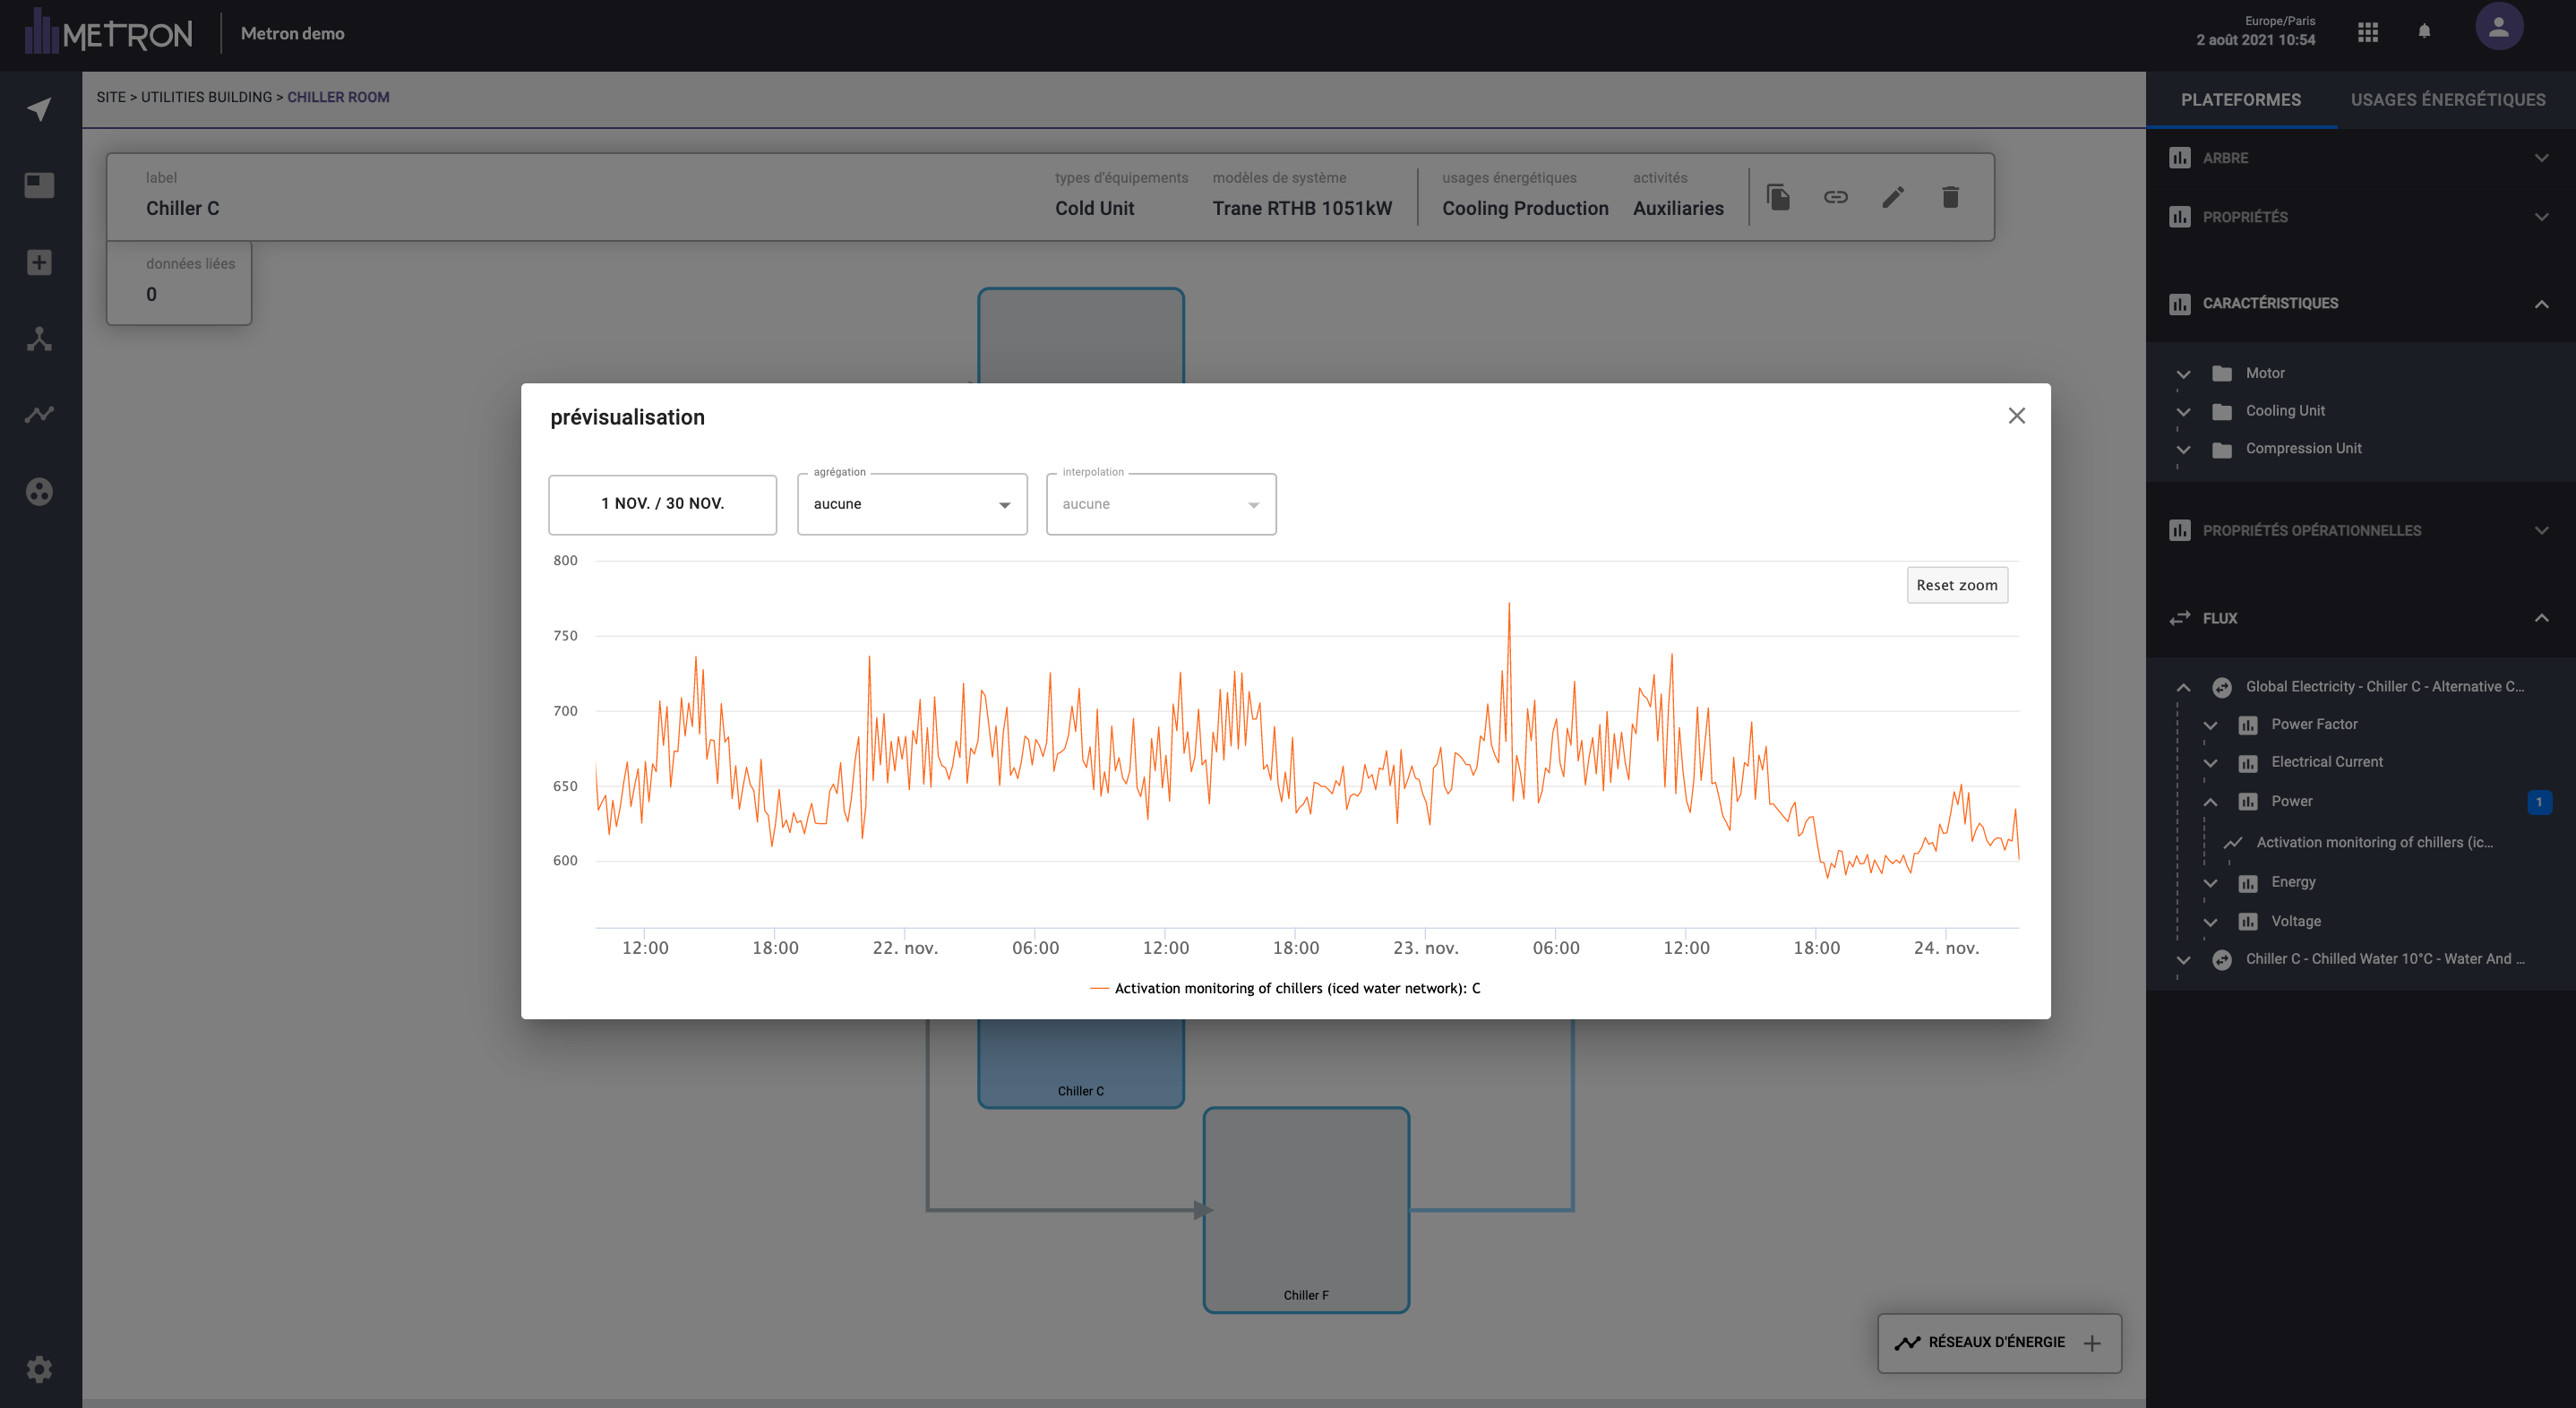
You can also preview the data of this tag by clicking on the "Eye" icon, next to the tag's name, and select a specific time period.