Introduction
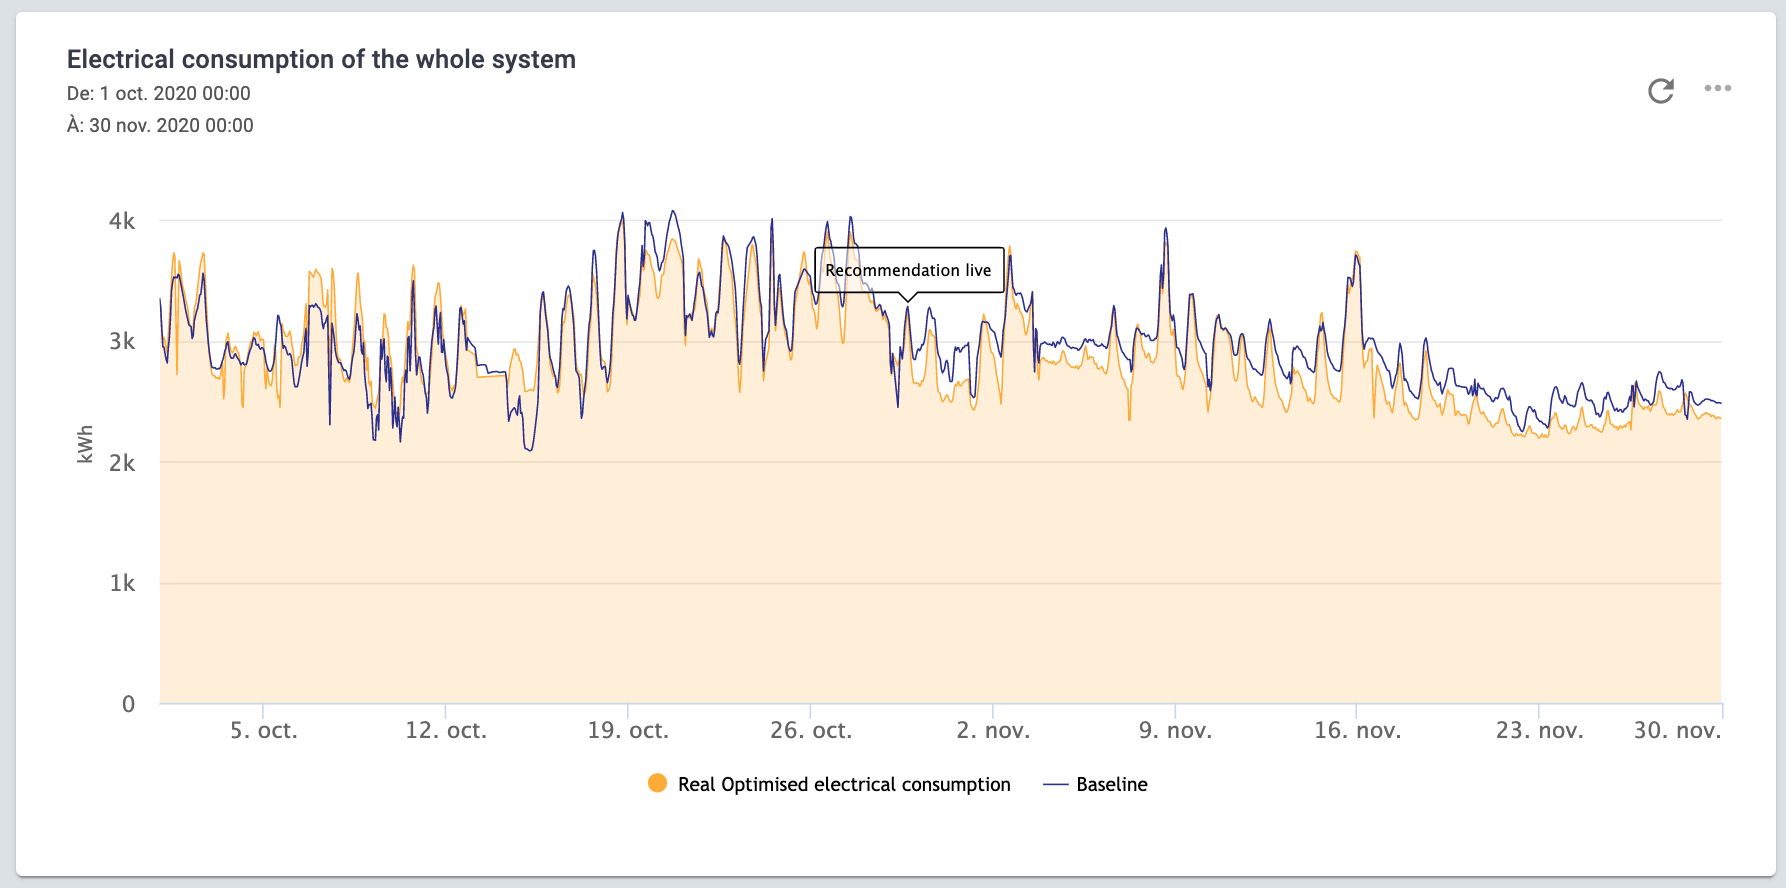
The axis chart is used to visualize the evolution of one or more variables over time. It is useful if you want to:
- Observe the trend of a variable over time
- Find an outlier
- Check a correlation, if plotting more than one variable in the same axis chart
- Detect and check the cyclability/seasonality: to what extent the data answer to a cyclical pattern
- Compare more than one variable
Main widget options
Access to the widget options in the widget editing menu, from the "Add widget" option or in by clicking on the "..." on the top right of the widget:
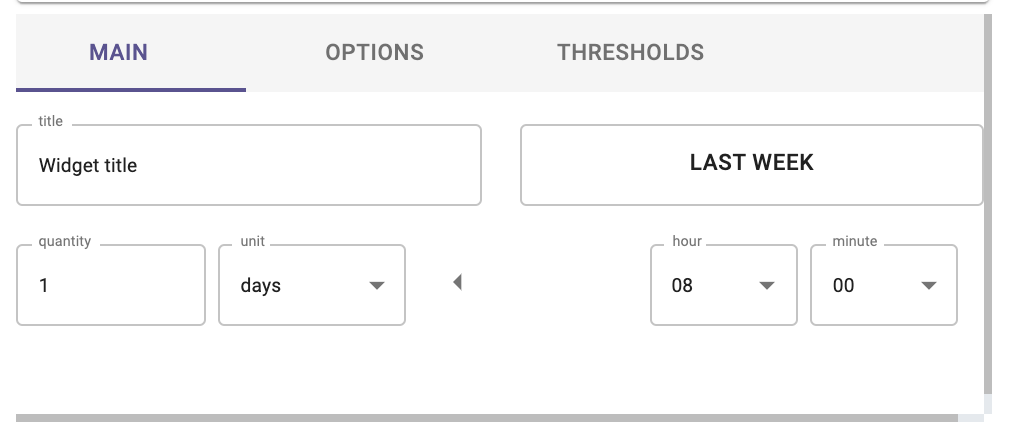
- Main: in this tab you can set the title, the time range and the granularity of the widget. You
can also set when the “given granularity” is supposed to start (see "Granularity offset" article). In the following screenshot, the user has set 1 day granularity, where the day starts at 8AM; this means that all points will be aggregated from 8AM to 8AM the following day.
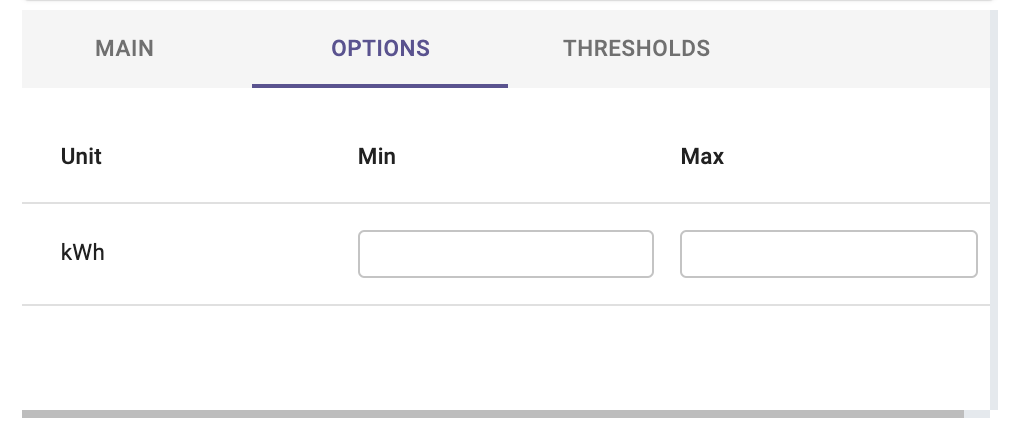
- Options: in this tab you can set the scale of each y-axis, selecting the minimum and
maximum values. There are as many y-axes as the number of units of measure.
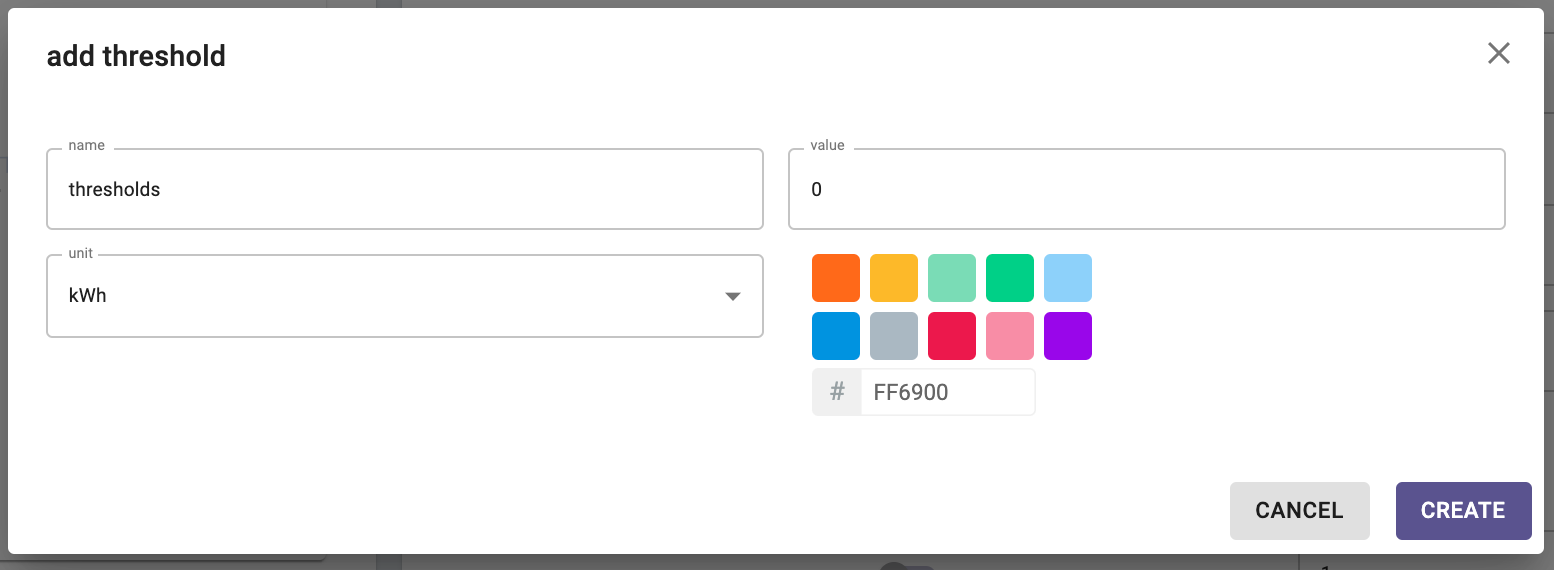
- Thresholds: in this tab you can set a constant value as a threshold. Values above the indicated
threshold will be coloured differently, according to the colour you have selected in the
thresholds tab. You need to indicate the units of measure of the threshold, among the units
already added to the graph. Multiple thresholds can be added to the same widget.
Widget configuration
When adding a new series to the axis chart, the following options are available:

- Data Source: select which variable you want to plot.
- Units: Select the unit of measure, among the list of units associated to that variable (for instance: °C, °F, K for temperature).
- Custom unit: manually change and set a custom unit of measure.
- Aggregation: Set the aggregation to decide how to aggregate the available raw points over the selected granularity. The following aggregations are available: min, max, count, difference, first, last, mean, weighted mean, sum, mode, none.
Note that, in case “none” is selected, the granularity at widget level is not relevant anymore. - Interpolation: Set the interpolation between points.
- Name: name your series, this name will be displayed in the widget legend and series tab.
- Series type: Decide whether the axis chart should be a line, a bar, or an area.
- Color: Change series color.
- Decimals: Set the number of decimal places.
- Line width: Change your series line width.
- Marker: do display a marker for each of your point in the chart.
- Radius/Symbol: Change the shape and the size of the marker.
- Dash style: personalize the line type (short dash, long dash, etc.)
- Offset: when enabled, it is possible to compare the value of your series with another defined period (e.g., compare the daily value with the week before).