The gauge is a visual indicator to check one quantity and compare it with selected reference values.

Main widget options
The following widget options are available for the Gauge:
- Main: you can set the title of the widget and the time range

- Options: you can set the minimum and maximum value of the Gauge (by default 0 and 100)

- Gauge steps: you can set the different areas of the widget, associating each of them with a given color.

Widget configuration
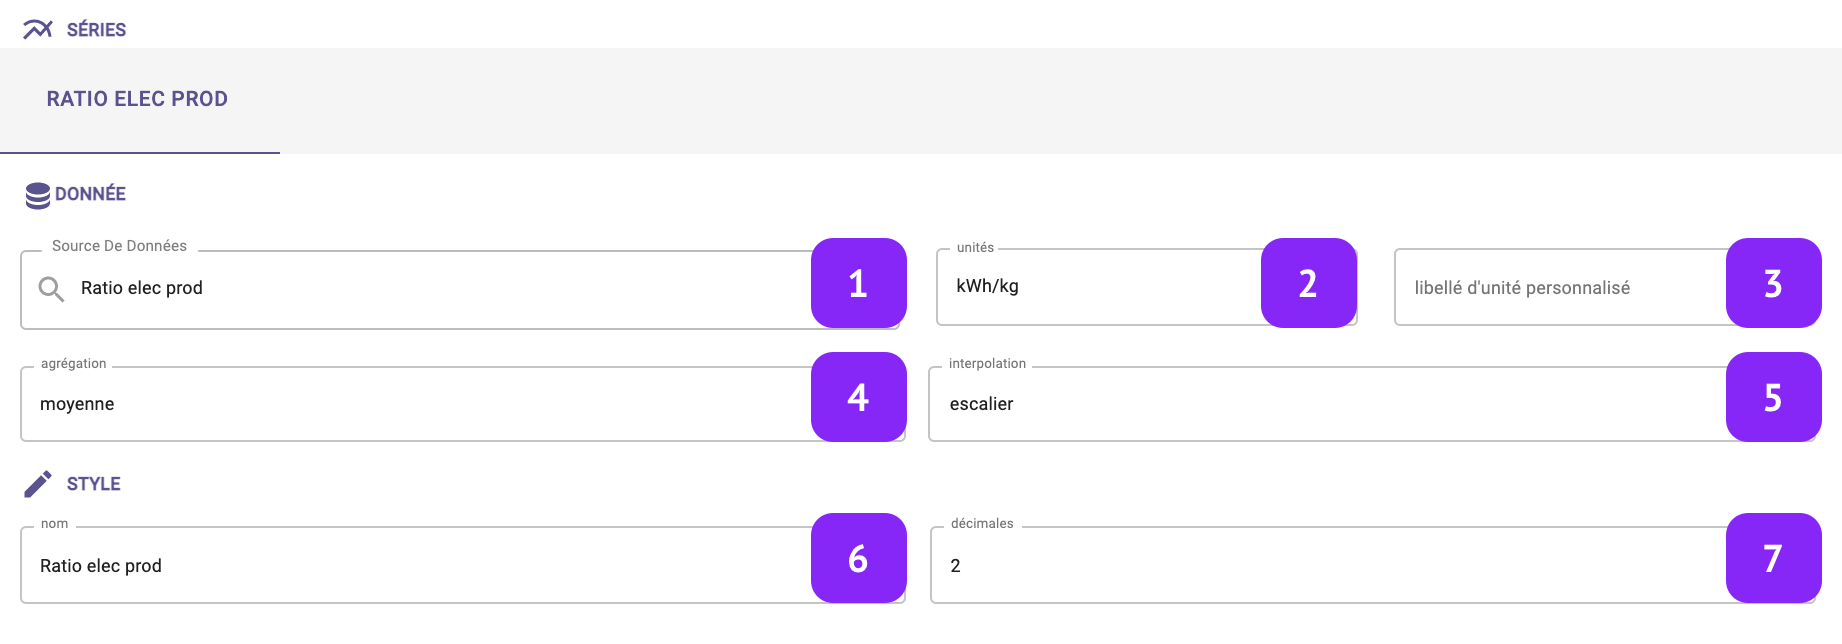
- Data Source: select which variable you want to plot.
- Units: Select the unit of measure, among the list of units associated to that variable (for instance:°C, °F, K for temperature).
- Custom unit: manually change and set a custom unit of measure.
- Aggregation: Set the aggregation to decide how to aggregate the available raw points over the selected granularity. The following aggregations are available: min, max, count, difference, first, last, mean, weighted mean, sum, mode, none. Notice that, in case “none” is selected, the selection of the granularity at widget level is not relevant anymore.
- Interpolation: Set the interpolation between points.
- Name: name your series, this name will be displayed in the widget legend and series tab.
- Decimals: Set the number of decimal places.