The metering plan module helps you visually represent your metering installation in a structured format (treeview) within the EOM site platform. It supports compliance with ISO 50001 (energy management system) and IPMVP (measurement and verification of energy performance) by helping define the energy data collection plan and identify new measurement requirements.
With this feature, you can :
- Display the hierarchical relationships between meters throughout the installation providing a comprehensive overview of the metering infrastructure
- Plan your measurement requirements and track your meter digitalisation progress
- Access key characteristics about each meter like technical and operational information
- Increase data source contextualisation by associating them to a meter.
1) Access de feature
- Open Energy Management workspace using the navigation side bar.
- Click on the Metering Plan tab.
2) Create a metering plan
- Click on the drop-down button in the bar on the top left of your screen
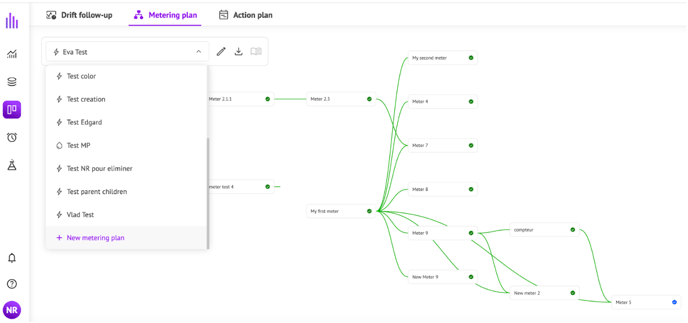
- Choose in the list “+ New metering plan”
- A window pops up:
- Fill in the name
- Choose the icon that corresponds to the energy vectors : electricity, gas, water, air, cooling
- Choose the color that will be applied to relationship links on the metering visualisation
- Click on Save button to create your metering plan

Note : Users can create as many metering plans as required. The settings of each metering plan can be changed at any moment.
3) Add a meter and define its characteristics
- Click on Add meter
- On the right side of your screen, the identity card of the meter is displayed
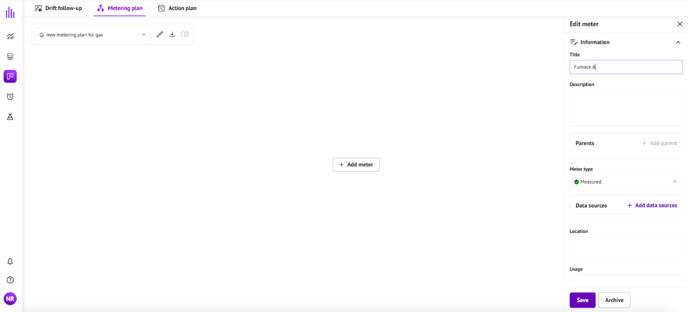
- Each meter is defined by :
- Title : it is mandatory to fill in an unique name
- Description : (optional) free text
- Parent(s) : (optional) you can choose among existing meters by clicking on the “+ Add parent” button. You can add several parents or leave the meter with no parent.
- Meter Type : choose the right one.
- Measured
- Virtual
- Planned
-
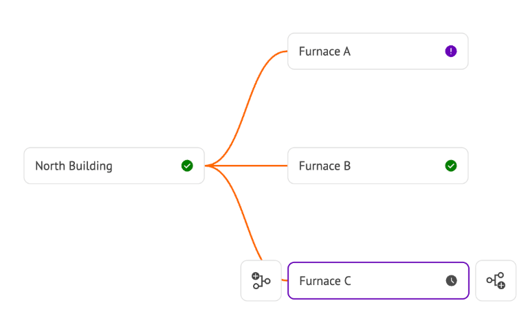
- Manual readings
An icon that corresponds to the type will be displayed on the chart. On the following example, gas consumption of furnace A is read manually, gas consumption of furnace B is measured and a new gas meter is planned to be installed on furnace C.
- Data sources : (optional) a meter can be linked to one or multiple existing data sources (tagpath) on the EOM platform, but a meter can be created without any associated data source.
- Location : (optional) free text to precise the physical location
- Usage : (optional) free text to indicate the energy uses
- Type of connection (optional) free text to complete the data transfer mode (e.g., Modbus, MBUS, etc.)
In addition to the meter information section, there are 2 more sections :
- Comments where users can add comments on meters, log events or any information required (this feature is similar to the one you can find on the drift follow-up module or on the action plan module
- History : Meter history is available to display creation and update log (similar to the drift follow-up or the action plan history feature).

- The new meter is created by clicking on the “Save” button and is then automatically displayed.
- Once created, all characteristics of a meter can be edited by selecting the meter and saving the changes. The metering plan will be updated automatically upon saving and modifications will be logged in the meter history.
- By clicking on the “Archive” button, the meter will be deleted. This entails the deletion of all links (parent & child) to this meter. The metering plan display is automatically updated, and meters that had direct child relationships to the archived meter will be displayed at head meter levels as new branches until a new parent is selected.
4) Relation parents-enfants
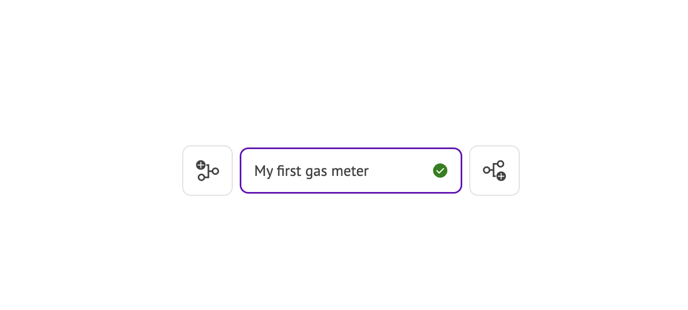
- After the first meter is created, new meters linked to this first meter can be created through the add meter icons. Meters are linked by parent-child relationships :
- Left button will add a new meter with parent relationship to the selected meter
- Right button will add a new meter with child relationship to the selected meter
- Clicking on the (left or right) button, the meter information window is displayed and the user should fill in its characteristics.
- The metering plan will display all the meters attached to this metering plan as cards linked by parent-child relationships to form a treegraph.
- The placement of meters on the metering plan is automatic.
- During creation or edition, a user can choose to link the meter to one or multiple parents by selecting them among other existing meters in this metering plan, but record that a meter can exist with no parent and no child.
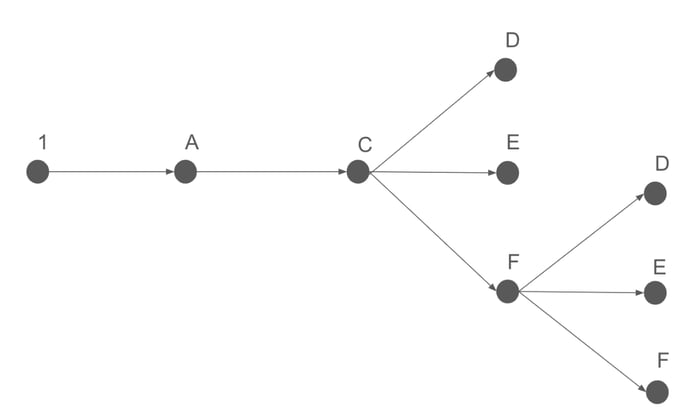
- 3 levels of tree complexity are possible through the parent-child relationships. Each node represents a meter, a real or virtual one, on the following graphes :
|
Simple treeview : one parent only for each meter |
|
|
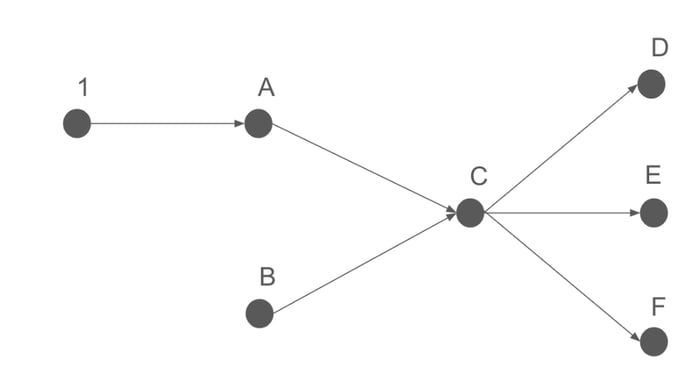
Multiple parents tree structure |
|
|
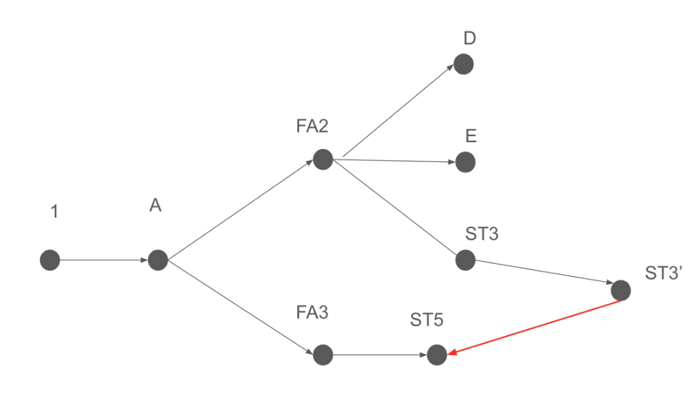
Cyclical relationship |
|
5) Export
Two exports are available by clicking on the corresponding icon in the bar at the top left of the screen:
- Export as PNG : it exports the picture of the currently selected metering plan
- Export as XLS : it exports the full list of meters for all metering plans available