The Action Plan module helps you plan, track, and validate Energy Performance Improvement Actions within the EOM platform. It supports compliance with ISO 50001 by documenting objectives, responsibilities, deadlines, resources, and evaluation methods for these actions.
With this feature, you can :
- Define and plan actions with clear savings targets
- Validate whether planned actions meet organizational energy goals
- Track project progress with Kanban and Gantt views
1) Access the feature
- Open Energy Management workspace using the navigation side bar
- Click on the Action Plan tab.
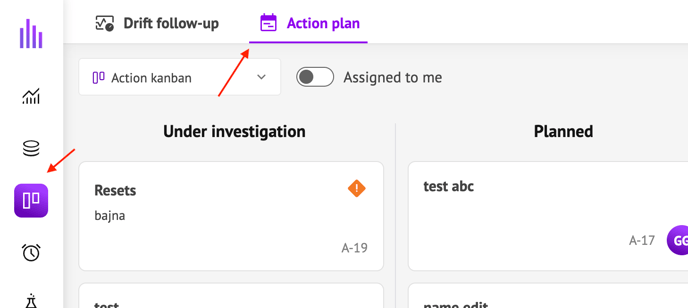
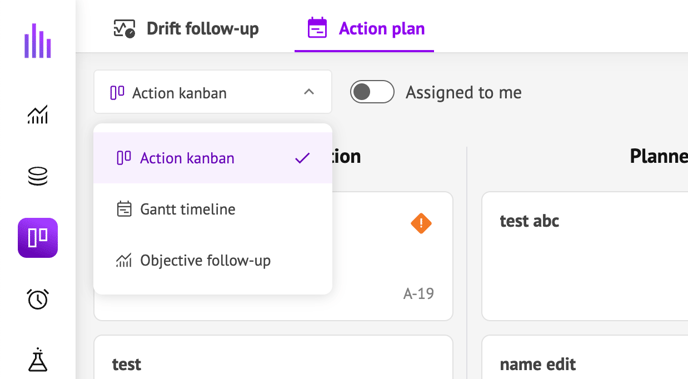
You’ll land on the Kanban view of the action plan. You can switch anytime between this, the Gantt and Objective follow-up views using the drop down menu.
2) Create an action
From the Kanban board :
1. Click on New Action.
2. In the form, fill in the following fields :
-
Name
-
Description (optional)
-
Status : by default, this will be set on “Under investigation”. You can update the status to Planned, Ongoing or Done at any time.
-
Expected Savings : this can be a fixed value (select “Fixed” in the drop down and enter an value in MWh/year) or a percentage of the annual reference consumption (select “Percentage” in the drop down)
-
Effected Perimeter : defines the reference consumption for the perimeter effected by the Energy Performance Improvement Action to evaluate the expected annual savings. It can be :
-
-
-
Manual value reference consumption (e.g., “210 MWh”)
-
Data source : select an existing tagpath on the platform from which we will automatically calculate the reference consumption. Selected tagpath must be in a unit convertible to MWh.
-
-
-
Reference Period : timeframe used to calculate the annual reference consumption period. When you calculate the annual reference consumption (directly from a tagpath or from the fixed value), you can select a reference period with a duration different from 1 year. But as savings are calculated in MWh/y, the reference consumption will be extrapolated to MWh/year automatically using the specified period.
-
Measurement and Verification (optional) : describe how you’ll verify savings. Link an existing data source or insert a link to a dashboard if relevant.
-
Allocated Resources and Operating costs (optional)
-
Planned timeline : optional if the action is still under investigation, mandatory to move the action the Planned, Ongoing or Done.
-
Assignee (optional)
3. Click Save to validate the creation of the action
4. The new action appears on a card in the column corresponding to its status.

3) Update an action on the Kanban board
Drag & drop a card between columns to update status.

NB : for a card under investigation with no planned timeline, when trying to move the action to another status, user will be prompted to add a timeline start and end dates to enable the status update.
Click a card to quick-edit:
- Change any information or value of the action
- Add comments to log in events, updates, additional information…
Activate the “Assigned to me” toggle to filter the view only on the actions assigned to me.
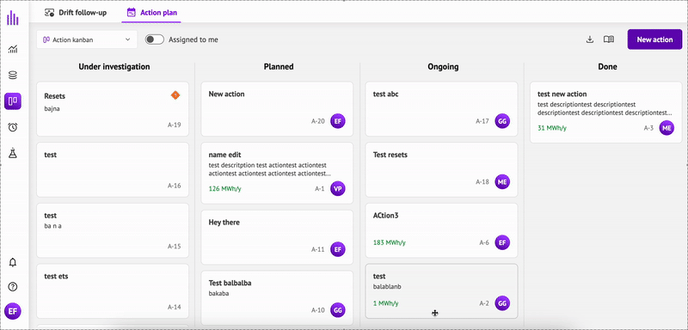
In case an action uses a data source that was deleted from the platform, a warning icon message will be displayed on the card so the user can update the missing information and enable savings calculations.
4) Visualize the long-term vision with the Gantt chart
1. Switch to Gantt view.
2. Each action with the status planned, ongoing and done shows as a timeline bar on the Gantt chart.
3. Drag the bar or either end of a bar to update timeline start/end dates.
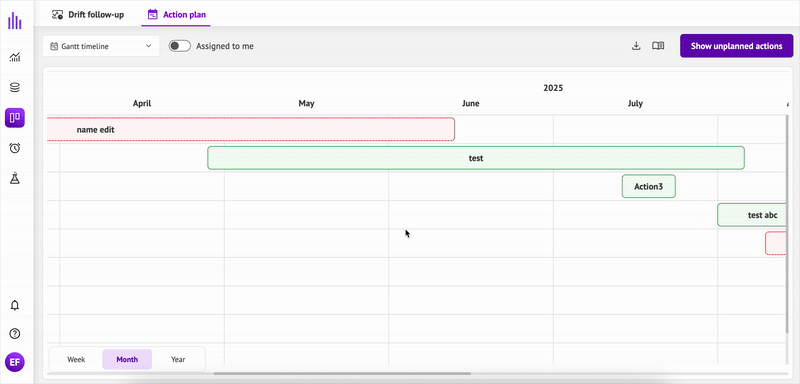
4. Click on “Show unplanned actions” to view the list of actions from “Under investigation” status. To add an action to the Gantt, click on the “Plan action” option on the action and enter start and end dates. The action will be moved to Planned status and be displayed on the chart.
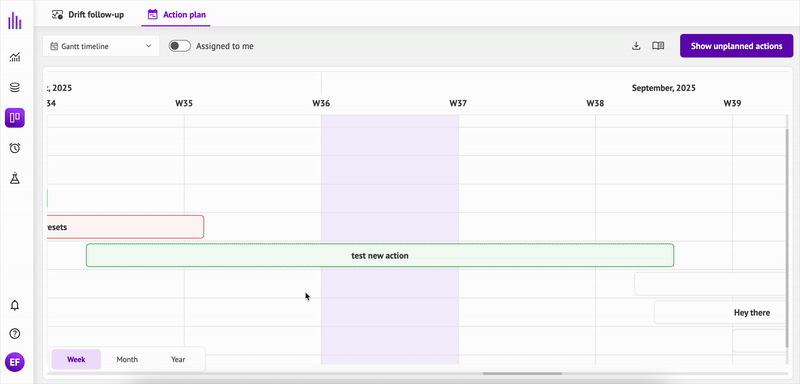
5. Overdue actions (= end date is indicated as today or before, and action is not yet marked as done) are highlighted in red. Done actions are highlighted in green.
6. Use the week / month / year setting to switch between the different scales of visualisation
5) Compare goal to plan with Objective Follow-Up
- Switch to Objective follow-up view
- Set site-level objective by clicking on Define objective
- Define the global consumption
- Provide site reference consumption : manual value in MWh or choose an existing tagpath (selected tagpath must be in a unit convertible to MWh)
- Specify the reference period of the selected consumption for conversion to MWh/y. When you calculate the reference consumption (directly from a tagpath or from the fixed value) you can select a reference period with a duration different from 1 year. But as savings are calculated in MWh/y, the reference consumption will be extrapolated to MWh/year automatically using the specified period.
- Define the global savings objective : choose between fixed annual value (MWh/year) or percentage of the annual reference consumption.
- Set the target date (must be after the end date of the reference period)
- Enter a name and an optional description.
- Click on Save to validate the global objective.
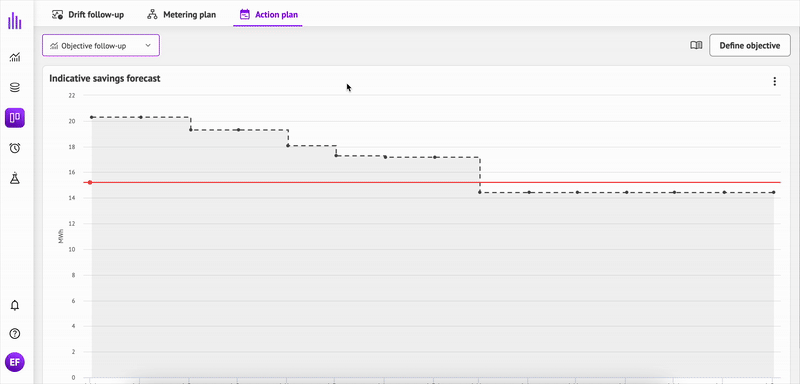
The platform then aggregates all actions’ savings (with start and end date) onto the site's annual reference consumption and applies them from each action’s savings end date up to the target date in a monthly scaling so the chart can show “goal vs. plan” over time until the end date of the global objective.
6) Export
From the Kanban or Gantt view, export the list of actions to Excel (.xlsx) format using the export icon.
On the objective follow-up chart, export the image of the chart using the option button and clicking on export.