Version 1.3.21 contains 3 major new features, detailed in this article:
- Assign series colors in a chart via a column in the source WorkSheet
- Possibility of displaying values on charts
- New option for CHART widgets: the bubble chart
- Other improvements and corrections
1) Set chart series color in source worksheet
With release 1.3.21, you can add a column in the source worksheet dedicated to the choice of color for each series.
It's still possible to choose a fixed color via the color-picker, but you can now drag a column from the source worksheet directly into the color field, and if that column contains a valid color code, the series will use it.
Permitted color codes are
- Hexadecimal codes ( ex: #ffcc33 )
- rgb codes ( ex: rgb(255,200,50) )
- rgba codes containing a transparency index ( ex: rgba(255,200,50,0.5) )
- Colors predefined in the HTML standard ( ex: red, blue, black, yellow... )
For each series to be displayed, the first line of that series in the source worksheet defines the color. The values present in the color column for each of the other lines in the same series will not be taken into account (whether they are empty, contain the correct value or others, has no influence on the result).
If the color code associated with a series is incorrect, the series will be displayed in black to indicate that there is a configuration problem.
When color is defined via the WorkSheet, it can come from anywhere:
- It can be hard-coded
if(column("RESOURCE")="ELECTRICITY"; "#ffa123";
if(column("RESOURCE")="NAT_GAS";"#5da430";"29a5fc")) - It can be built dynamically (RED, GREEN and BLUE columns can contain
contain formulas, or these formulas can be directly encapsulated in the code
below)
"rgb("+column("RED")+";"+column("GREEN")+";"+column("BLUE")+")" - It can be retrieved from a global variable stored in the EMM configurator
Globalvalue("ELEC_COLOR")
Color standardization in a DB
In order to standardize the color codes used in a customer's DB, and to be able to modify the graphic identity of a customer's graphic identity, it is now possible to follow these steps:
1. Define the color code to be used in the DB global variables table.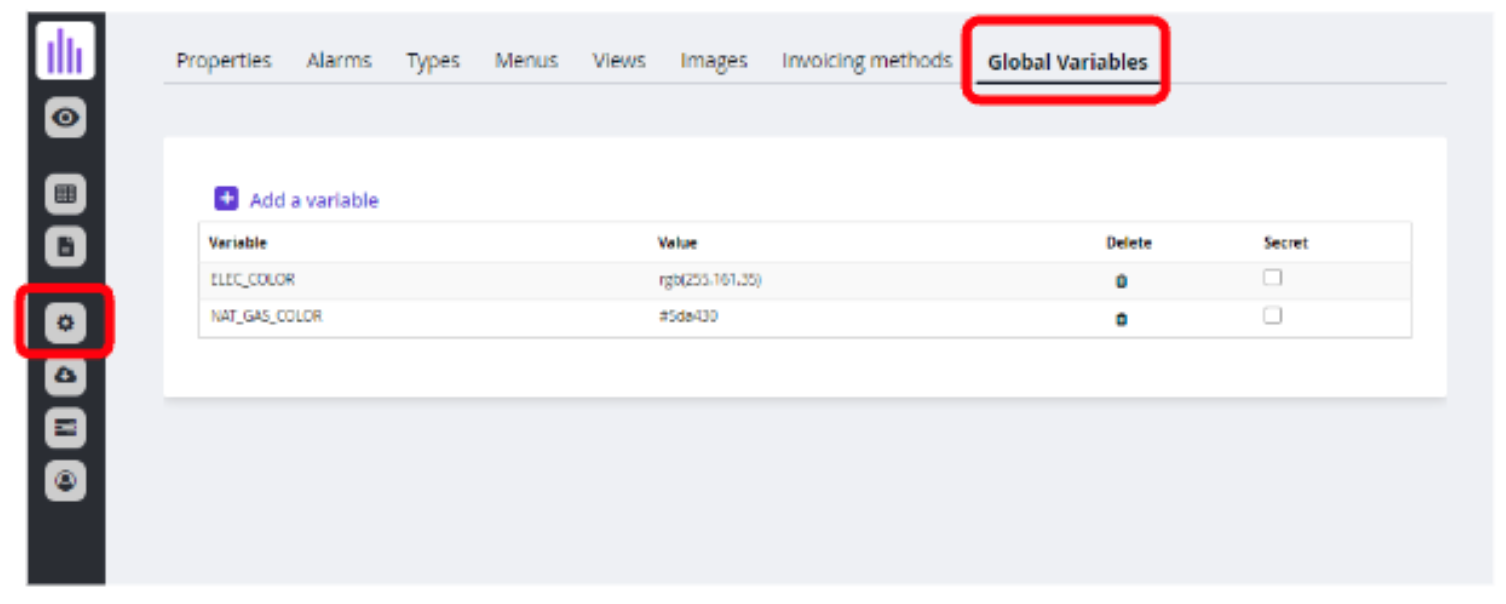
The color code can therefore be in rgb, rgba or hexadecimal.
Note: don't put quotation marks around color codes.
2. For each Widget, create a column retrieving the color from its source Wsht
Create a WorkSheet with all the necessary columns (legend reference, date from, value to be displayed, and resource.key).

In this example, the color is based on the RESOURCE column in order to retrieve the color defined globally for electricity, for natural gas, or a default color if you have another resource.
3. Use this column in the definition of the graphic widget
The color column is dragged into the COLOUR field. From this point onwards, the first line of each series to be displayed in the WorkSheet will define the color of the series via the value present in its box in the COLOR column.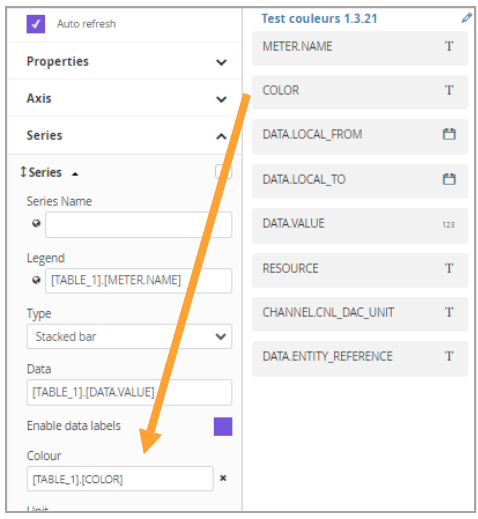
Note: you can have several series in different columns of the worksheet, and therefore have as many associated COLOR columns to be dragged into the COLOUR fields of each series definition.
We can also have a single series definition containing several sub-series (differentiated by their different values in the column used as a legend), and in this case have a single COLOR column, but which will contain different values depending on the sub-series to be colored.
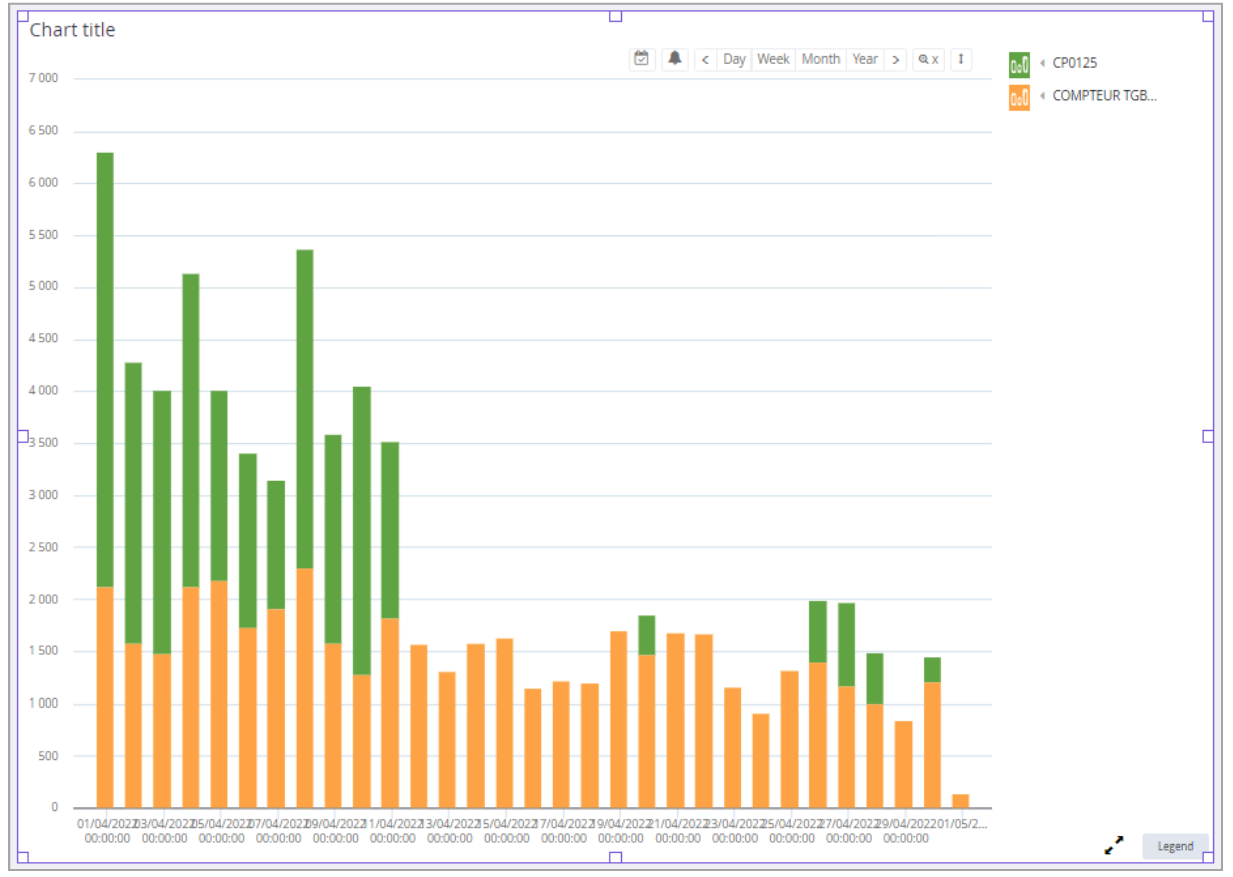
Result:
4. Retrieve global color from CSS Report
As color is defined in global variables, it can also be retrieved from HTML reports and more specifically in the CSS that will be included in each client report.
The style to be added will look like this:
.elec_back { background-color: }
As this CSS is then included in all customer reports, we can use the corresponding classes to apply them to the relevant areas (title <div> background, data table cells... )
5. When changing color codes
If the customer changes his graphic identity and wishes to modify his color code, he can simply modify the color definitions in the global variables, and this will impact all the charts and HTML reports at once, without having to retouch all the charts and/or html one by one.
2) Display numerical values in your charts
A new option is available in chart widgets. A checkbox lets you display the numerical values associated with the graph directly on the chart.
Numerical data values are then displayed directly on the bars, or above the points in the chart (be careful to round them off in worksheets to avoid overloading the graphs).
3) New option for CHART widgets: the Bubble Chart
An additional option is now available in the chart editor: the Bubble chart.
The idea is to create a graph of points and assign to each of them a weight defining the size of the point to be displayed.
By selecting the "Bubble" option, a new "Weight" field appears, into which you can drag and drop a column from the source worksheet to assign a weight (and therefore a size) to each point. A second "Labels" field lets you display a text for each point, from a worksheet column.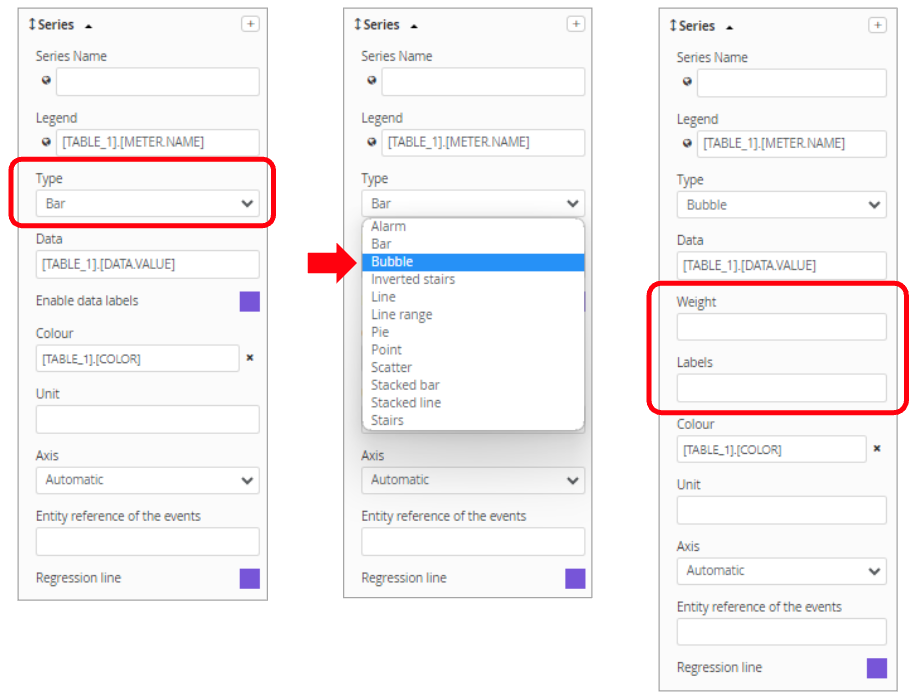
The result is as follows:
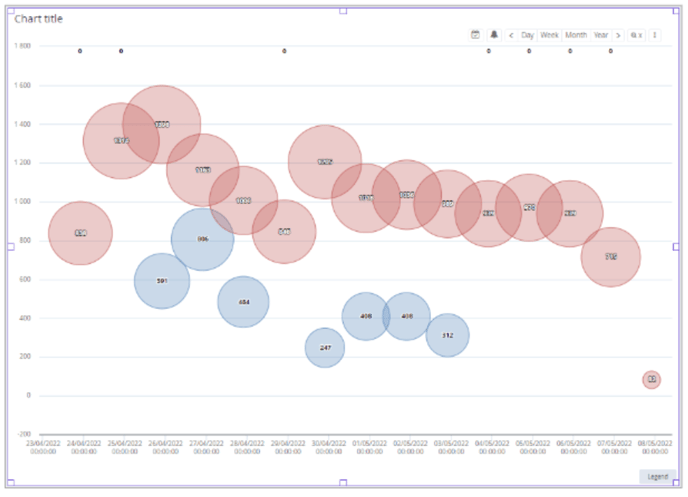
The weight defines the size of the bubble, and the label (optional) indicates what to write in the bubble.
4) Improvements and corrections
- A problem with sending data entered in a form contained in a kiosk link has been resolved.
- When cloning a tool (xtab, dataset, worksheet... ), the newly created clone is no longer saved by default when created. This makes it possible to run tests on clones without having to come back and delete them later. On the other hand, you must not forget to save them if you want to keep them.
- System optimization when building SQL queries using pivot tables. This greatly improves the performance of complex datasets.
- System optimization for retrieving invoices and their properties from datasets.
- The Xtab editor was displaying context/selection fields that have no use in Xtabs: these simulation fields have been removed from the interface.
- Resolved a particular problem whereby empty cells in CSV exports via the ".tocsv" function empty cells could be incorrectly taken into account.
- When a numerical vector was present in a Worksheet numerical cell, the cell would displayed only the first value of the vector, without indicating that there were others. This could lead to errors when the cell was reused elsewhere in the code. This problem was particularly difficult to detect.
From now on, when a vector is present in a worksheet cell, a warning message is systematically displayed to the user. This mechanism has been extended to all cell types as soon as the value present in the cell does not correspond precisely to the type defined for the column.
In the examples above,
A= a number will be accepted in a "Number" column or in a "Text" column
B= a numerical vector is not accepted as text
C= a numeric vector is not accepted as numeric
D= a numeric value (1) will not be accepted as Boolean
Hovering over the small red exclamation mark brings up a tooltip explaining the problem and displaying the value that tried to be displayed.
