Table of contents
Click on the content of your choice to access it directly:
1. A library of templates to create your own dashboards in just a few clicks
2. Display the percentage change in the counter widget
3. Access release notes directly from the platform!
4. Duplicate your dashboard sections
5. Easily reorganize your dashboard sections
6. New window for page creation
7. Bug fixes
1. A template library to create your own dashboards in just a few clicks
- Go to the Data visualization area
- Click on "Add page"

- Enter the name of your new dashboard
- Select the folder in which your dashboard is to be included
- Select "Template" as page type
- Choose the automatic refresh interval you wish to apply to your new dashboard
- Click on Next
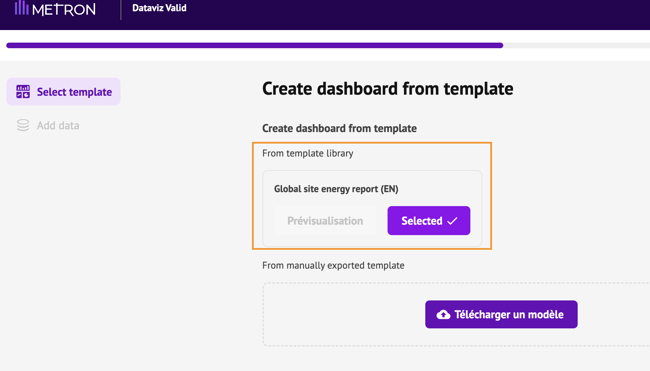
- Select the template of your choice.
For the moment, the Global Site Energy Report dashboard is available in English. This is a global report on overall energy consumption (electricity, gas, water), production, energy costs, consumption by utilities (compressed air, cooling, hot water).
If you'd prefer to download a dashboard template you've already created on another METRON platform, read the article Import a dashboard template into a METRON platform.

- Fill in all the data required for the dashboard.
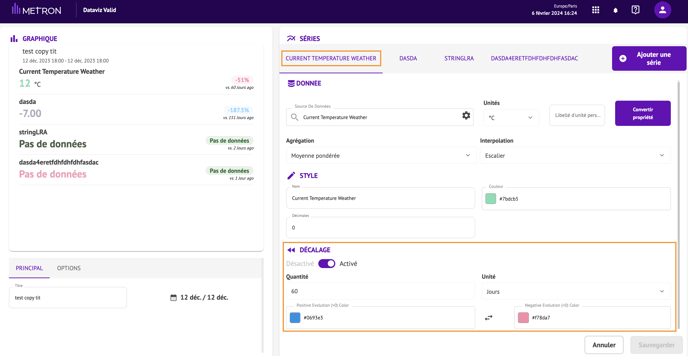
2. Display the evolution percentage in the counter widget
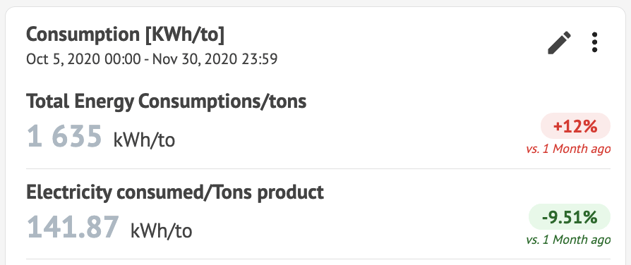
To display the percentage of evolution of the data displayed in relation to a chosen period, go to the counter widget editor.
- Click on "Edit".
- In the "Offset" section at bottom right, activate the display of the percentage change in the series.
- Define the period with which you wish to make the comparison, specifying the number of minutes / hours / days / weeks / months or years.
- Set the color to be assigned to your percentage (1 color for positive value, 1 color for negative value). You can invert the colors by clicking on the double arrows.
- Repeat the operation for each counter series for which you wish to display the percentage change.
3. Access release notes directly from the platform!
Access product evolutions at any time by clicking in the top left-hand corner of your screen:

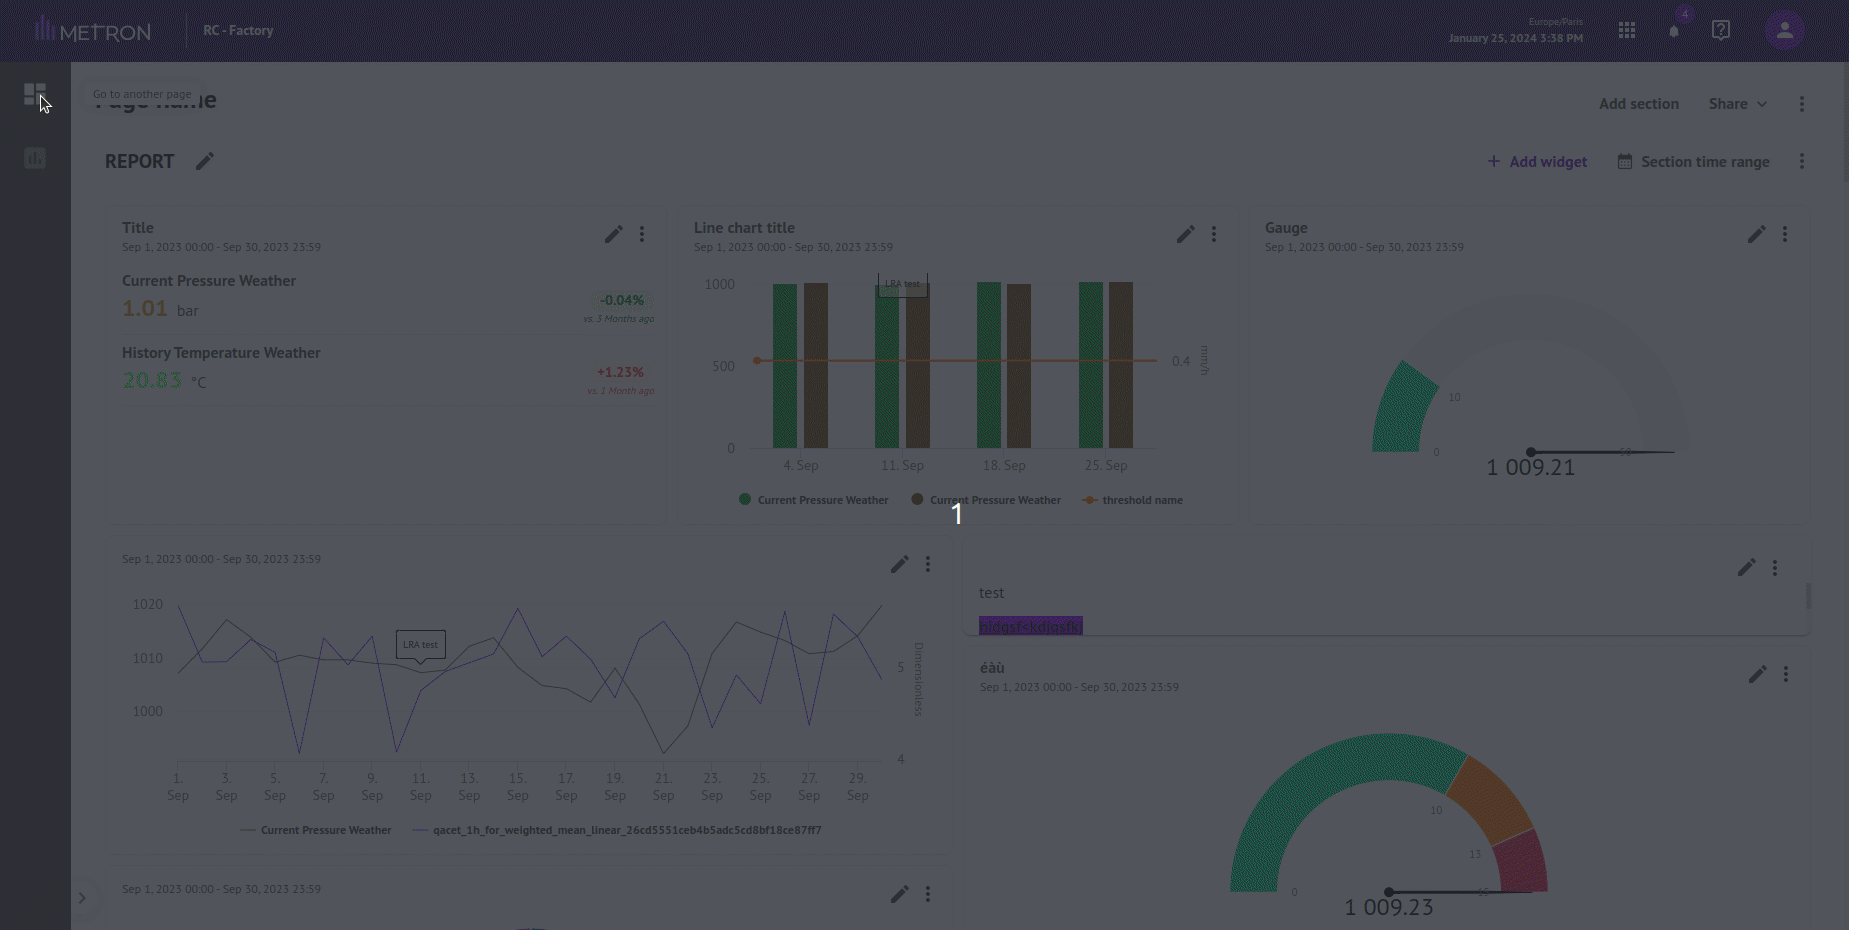
4. Duplicate your dashboard sections
In addition to dashboards and widgets, you can now copy and paste a section into the same dashboard or another page.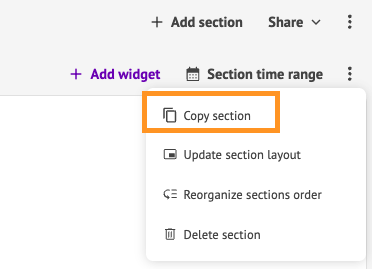
- Click on "..." of the section and "Copy section".

- In the dashboard of your choice, click on "..." at the very top right of your screen and select "Paste section".
5. Easily reorganize your dashboard sections
Reorganize the sections that make up your dashboards by clicking on "..." at the section level, then on "Reorganize sections".
You can then drag and drop them as you wish:

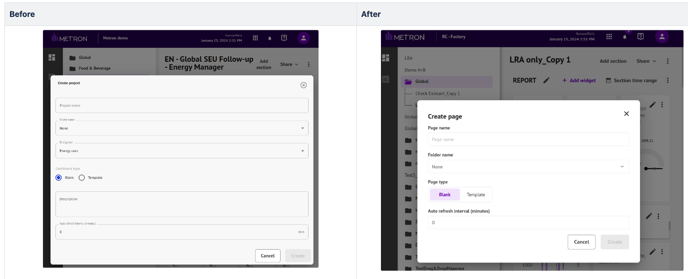
6. New window for page creation
- Replacement of the term "project" by the more appropriate "page".
- Removal of "Energy use" and "Description" fields.
7. Bug fixes
- Updated German, Polish and Turkish translations.
- Removed zoom on gauge widget to prevent it from malfunctioning.