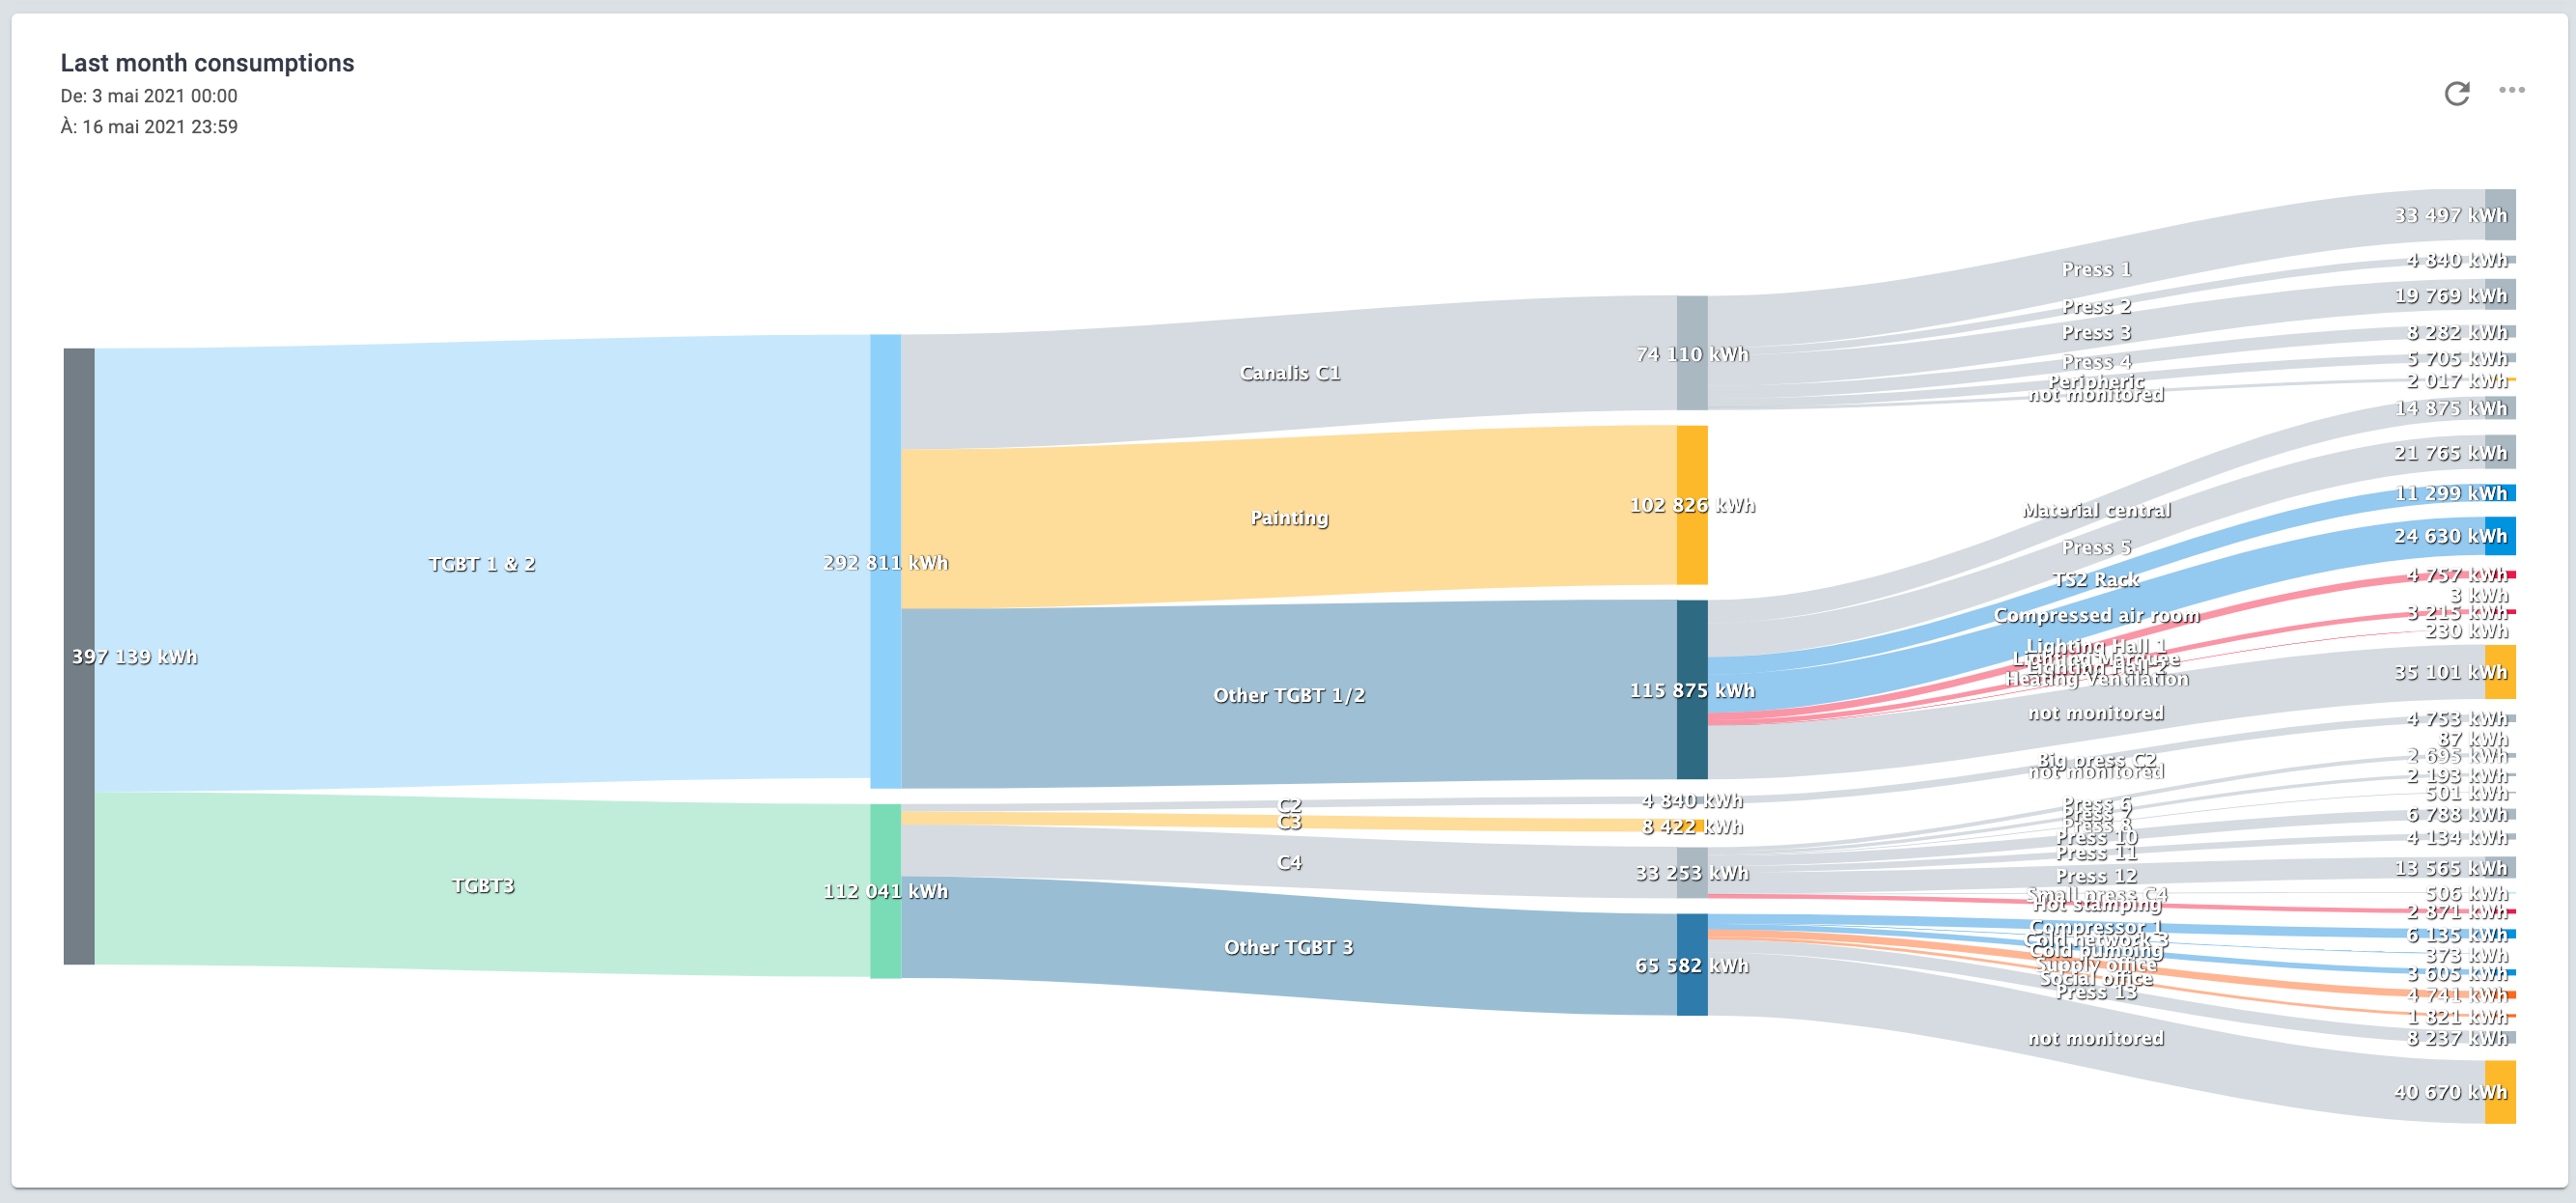
The Sankey diagram is a flow diagram with multiple branches. Each branch's width is proportional to the variable values associated to those branches.
The Sankey diagram is composed of:
- Nodes: usually perimeters/sites
- Flows/Branches: usually consumables (energy, gas, water…)
The Sankey diagram represents all the primary energy that flows into your factory. The widths of the bands are linearly proportional to energy production, utilization and loss. The primary energy inputs enter the left side of the diagram, and are differentiated into different energy uses.
The Sankey is used to represent where energy is consumed and where the potential data loss could be.
It also allows you to follow the consumption from different levels of the plant (factory, buildings, perimeters, final consumer).
Main widget options
The different widget options available are:
- Main: you can define the widget title, the time interval, the unit of measurement and the number of decimal places

Widget configuration
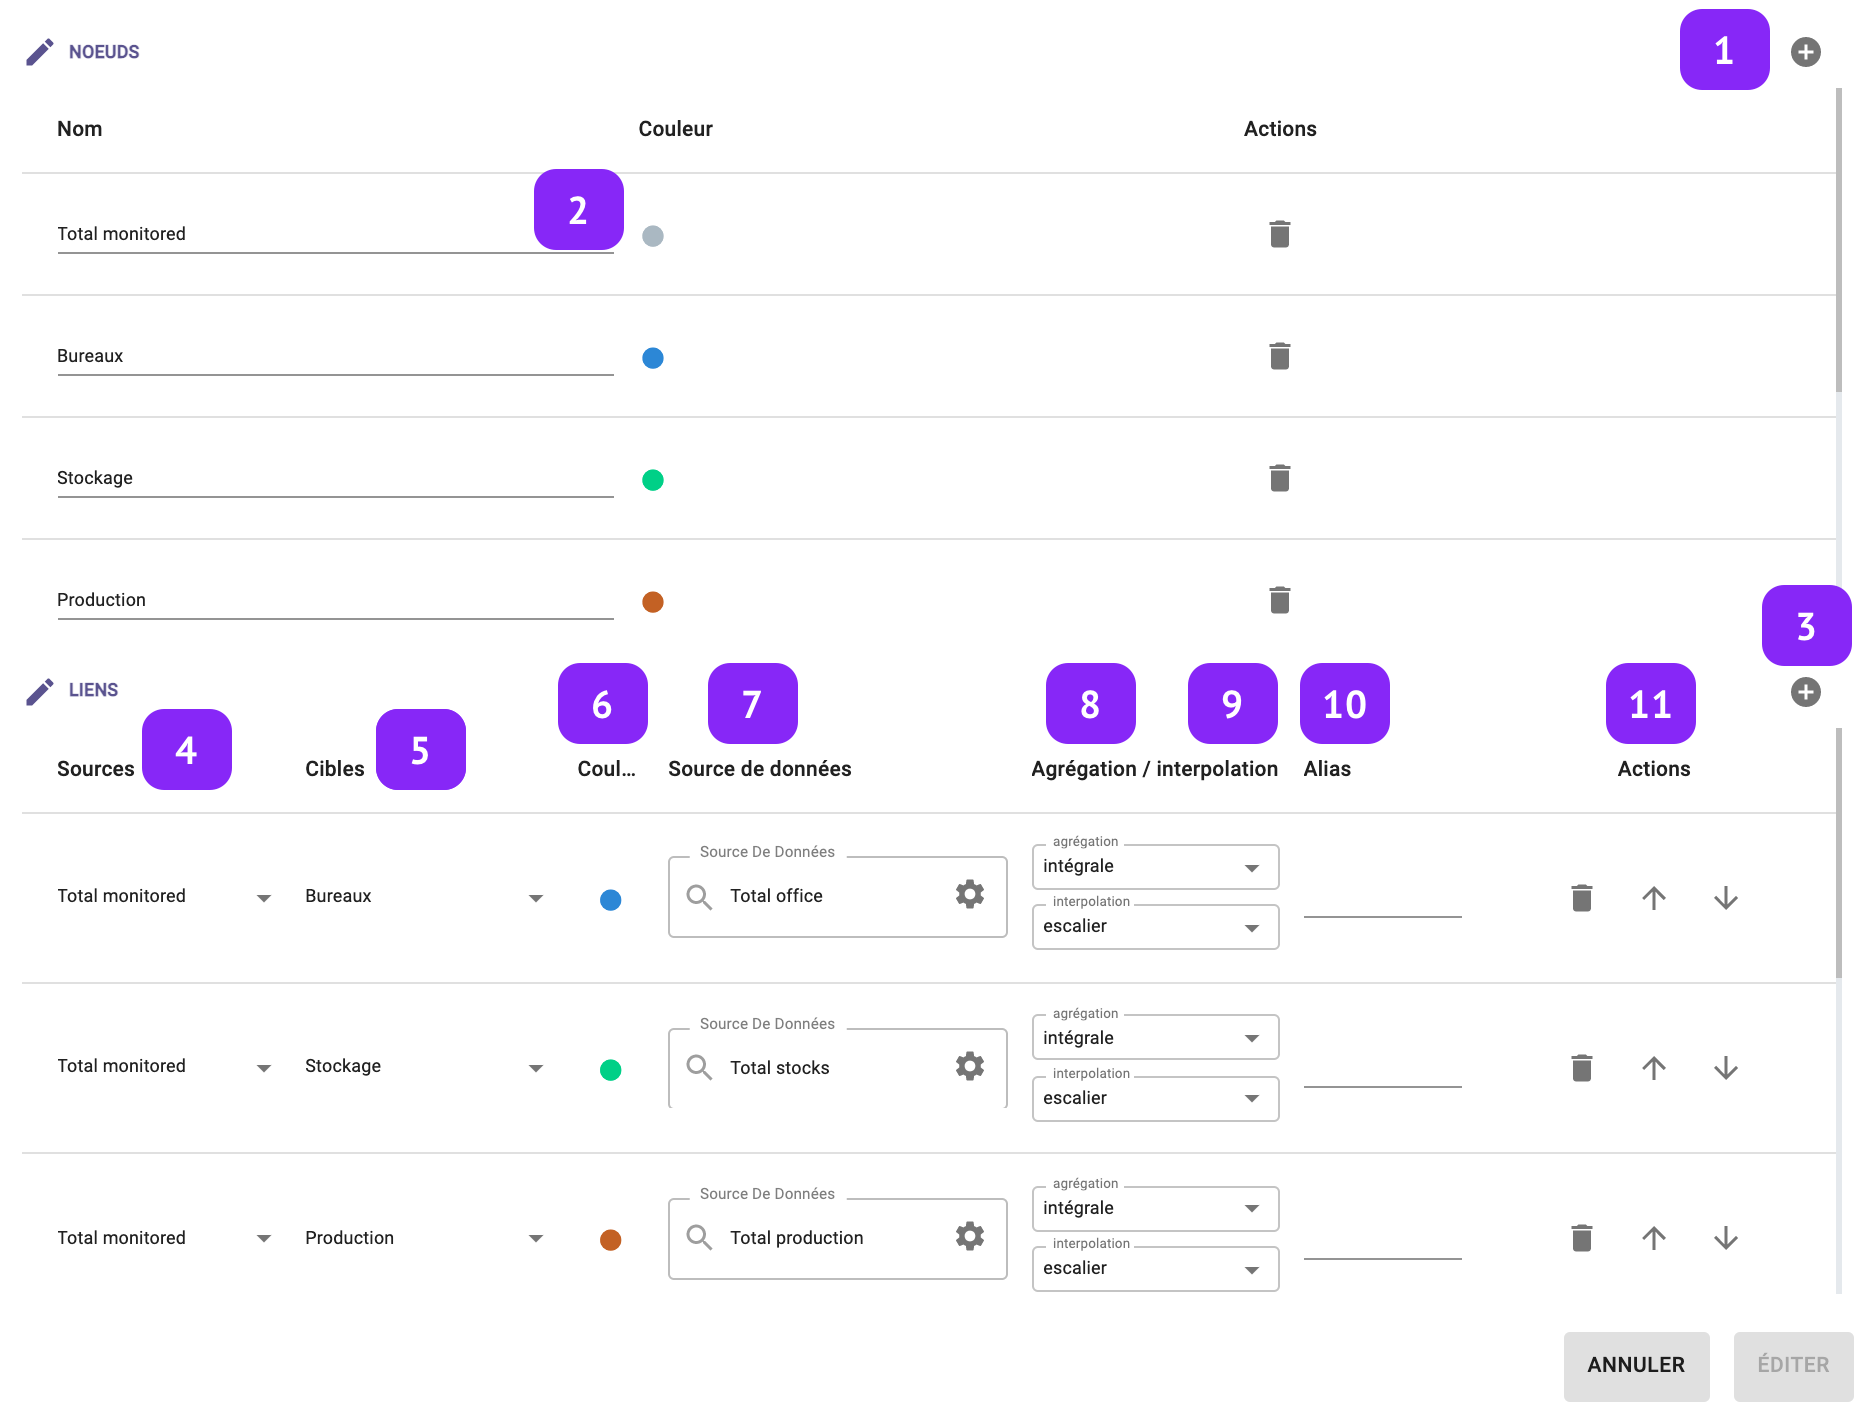
- Add node: Add a new node from/to which the branches are connected
- Property: Set the property of the node: its label and colour
- Add branch: Add a new branch/link associated to a given variable
- Sources: Set the origin node
- Targets: Set the destination node
- Color: Set the color of the branch
- Data source: Select the variable
- Aggregation: Select the variable aggregation
- Interpolation: Select the variable interpolation
- Alias: Select the variable label
- Actions: Move or remove the branch in the Sankey
Note that the Sankey diagram automatically calculates the “not monitored” branch by difference.
Please note that it is not possible to save an incomplete Sankey. If a node or branch has no termination, you will not be able to save or edit that Sankey.